
Figures & data
Table 1. Clinical characteristics and follow-up data.
Table 2. Prognostic analysis for OS.
Figure 1. Prognostic analysis for OS. A: Kaplan-Meier curves for each stage. B-E: Prognostic factors (age, WBC count, LDH, β2-MG) indicating differences in OS in patients with advanced-stage disease.
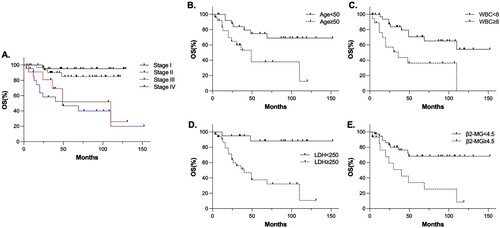
Figure 2. Prognostic analysis for PFS. A-D: Prognostic factors (age, WBC count, LDH, β2-MG) indicating differences in PFS in patients with advanced-stage disease.
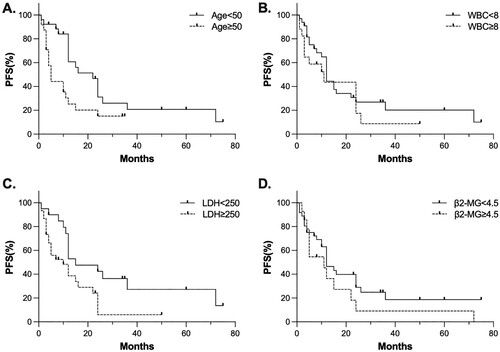
Table 3. Prognostic analysis for PFS.
Figure 3. Treatment outcomes in advanced-stage patients. A: Mean PFS ± CI for each treatment group. B: PFS curves for each treatment groups. P < 0.01 (log rank comparison). C: Mean OS ± CI for each treatment group. D: OS curves for each treatment groups. P = 0.03 (log rank comparison).
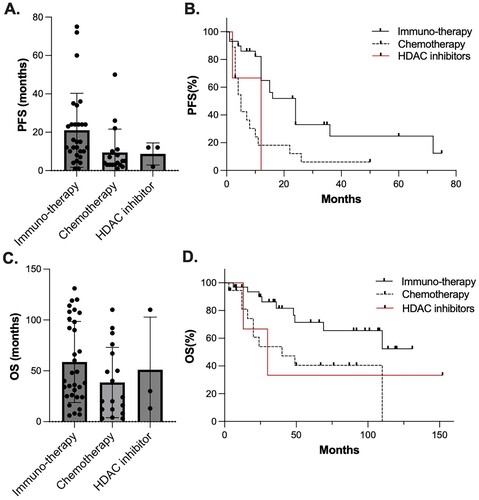
Table 4. Response and survival of different treatments in advanced-stage patients.
Supplementary Material
Download MS Word (10 MB)Supplementary material
Download MS Excel (29.6 KB)Data availability statement
The datasets analyzed for this study can be found in supplementary Table S2.