
Figures & data
Table 1. Clinical features of patients with MM and healthy control patient.
Table 2. Primer sequences used for detecting BNIP3L SNPs.
Table 3. Genotype and Allele frequencies of BNIP3L polymorphisms for MM and healthy control groups.
Table 4. Associations of BNIP3L polymorphisms with clinical parameters of patients with MM.
Table 5. Associations of BNIP3L polymorphisms with clinical parameters of patients with MM.
Table 6. LD analysis the relationships between six SNPs of BNIP3L gene and risk of MM.
Table 7. Major haplotype frequencies of BNIP3L gene in MM and control patients.
Figure 1. Kaplan-Meier survival curves of MM patients with different BNIP3L polymorphisms and clinical parameters by log-rank test (A–F: rs17310286, rs3758098, rs2874670, rs10503786, rs73217800, rs1042992, all P > 0.05; G–J: R-ISS stage, LDH, β2-MG, Treatment, all *P < 0.05; K–P: Age, Gender, Hb, Cr, and Plasma cells, Chemotherapy regimens, all P > 0.05).
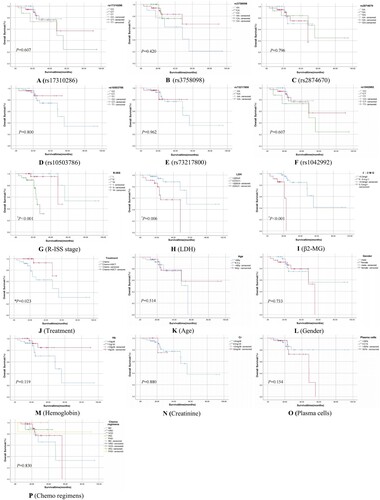
Table 8. Cox regression analysis of risk factors for mortality in MM patients.