Figures & data
Figure 1. The transcript expression of lnc-AC004893 is increased in MPN patients than in normal controls. (A) LncRNA sequencing analysis was performed using BM cells from three MPN patients and three normal controls (NCs). Heatmap representation of dysregulated lncRNAs. (B) Gene Ontology (GO) enrichment analysis was performed to compare gene sets in MPN patients and NCs. (C) Gene set enrichment analysis (GSEA) was performed by comparing transcriptional profiles of MPN patients and NCs. The enrichment score plot shown corresponds to the regulation of genes about the JAK2/STAT signaling pathway. The NES and P-values are shown. (D) qRT-PCR was performed to measure the transcripts of indicated lncRNAs in HEL cells, which were transfected with siRNA for the indicated lncRNAs or scramble siRNA (SCR) for 48 h. (E) Cell proliferation in HEL cells transfected with siRNA for the indicated lncRNAs or SCR was measured by CCK8 assay. (F) The expression of lnc-AC004893 was measured in BM mononuclear cells from 150 MPN patients (60 PV, 60 ET, and 30 PMF) and 20 NCs by qRT-PCR. (G) The level of lnc-AC004893 was analyzed between PV, ET, and PMF patients. N.S: not significant. *** P < 0.001.
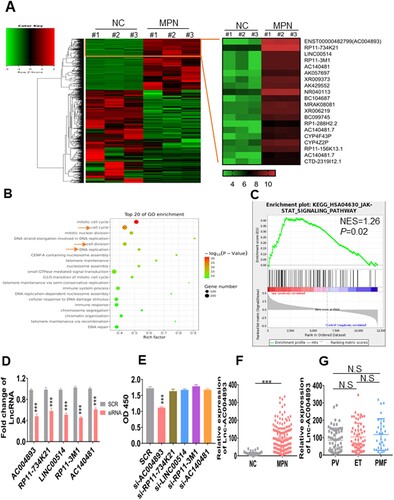
Figure 2. Inhibition of lnc-AC004893 reduces cell proliferation and colony formation in MPN cells. (A) HEL cells were transduced with shRNAs for lnc-AC004893 (sh-AC#1 and sh-AC#2) or negative control (sh-NC). After puromycin treatment for four days, the transcript of lnc-AC004893 was measured in HEL cells. (B) Viable cells were counted in HEL cells after transduction with sh-AC or sh-NC for 24, 48, and 72 h. (C) Colonies were scored in HEL cells after transduction with sh-AC or sh-NC. HEL cells (1 × 10³) were plated into a methylcellulose medium. Shown are the representative pictures showing colonies (left) and statistical analysis of scored colonies (right). Bar represents 50 µm. (D) The transcript of lnc-ac004893 was measured in IL-3-treated Ba/F3 cells transduced with shRNAs for murine lnc-ac004893 (sh-ac#1 and sh-ac#2) or sh-nc. (E) Viable cells were counted in Ba/F3 cells after transduction with sh-ac#1, sh-ac#2, or sh-nc. (F) Colonies were scored in Ba/F3 cells after transduction with sh-ac#1, sh-ac#2, or sh-nc. * P < 0.05; ** P < 0.01; *** P < 0.001.
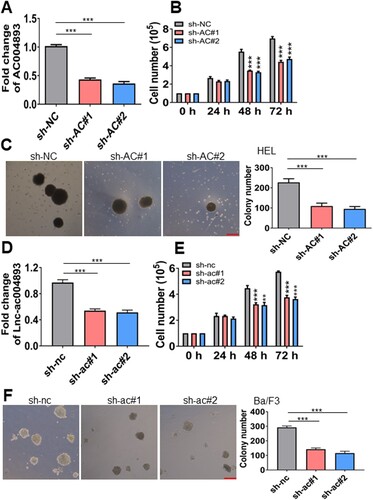
Figure 3. Lnc-AC004893 regulates the p-STAT5 level. (A and B) The protein expressions of JAK2/STAT signaling were measured in HEL cells (A) transduced with sh-AC004893 (sh-AC) or negative control (sh-NC) and in mIL-3-treated Ba/F3 cells transduced with sh-ac or sh-nc (B). (C) The lysates from HEL cells transduced with sh-AC or sh-NC were immunoprecipitated by an anti-STAT5 antibody or IgG. STAT5 and SHP1 were blotted in the immunoprecipitated lysates. (D) The lysates from HEL cells transduced with sh-AC or sh-NC were immunoprecipitated by an anti-SHP1 antibody or IgG. STAT5 and SHP1 were blotted in the immunoprecipitated lysates. (E) Lnc-AC004893 level was measured in anti-STAT5 and anti-SHP1 immunoprecipitations. *** P < 0.001.
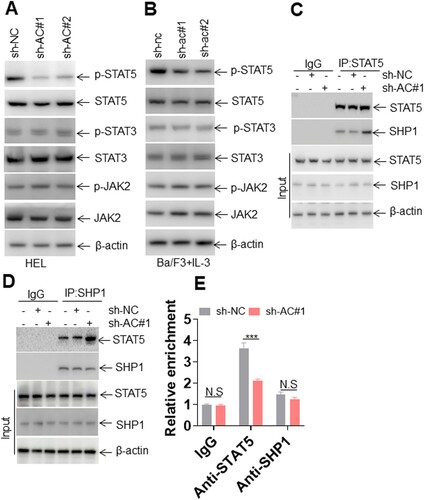
Figure 4. Lnc-AC004893 promotes STAT5 signaling. (A) Luciferase activity was measured in the lysates of 293 T cells, which were transfected with pGL-3 containing STAT5 luciferase reporter and different amounts of pcDNA3-lnc-AC004893 for 24 h. (B) p-STAT5 tyr694 and total STAT5 were measured in HEL cells transduced with LVX-lnc-AC004893 overexpressing lnc-AC004893 or LVX-NC. (C) Cyclin D1 and c-MYC transcripts were measured in HEL cells transduced with LVX-lnc-AC004893 or LVX-NC. (D and E) The transcripts of cyclin D1 and c-MYC were measured in HEL cells transduced with shRNAs for lnc-AC004893 (sh-AC#1 and sh-AC#2) or sh-NC. ** P < 0.01; *** P < 0.001.
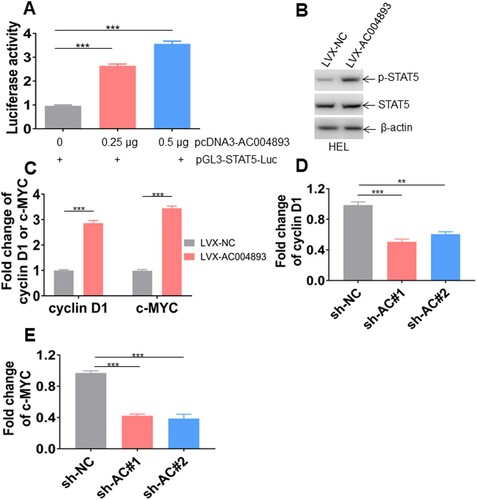
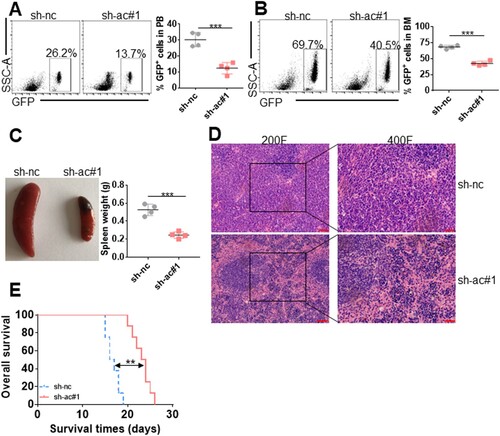
Figure 5. Knockdown of murine lnc-ac004893 attenuates phenotypes in the JAK2-V617F-driven disease model. (A and B) The percentages of GFP+ cells were measured in peripheral blood (PB, A) and BM (B) from Ba/F3-JAK2V617F-sh-nc-transplanted mice (n = 4) compared with Ba/F3-JAK2V617F-sh-lnc-ac#1-transplanted mice (n = 4) at 17 days after transplantation. The representative plots (left) and statistical analysis of GFP+ cells (right) are shown. (C) The representative images of the spleen (left) and statistical analysis of spleen weight (right) from Ba/F3-JAK2V617F-sh-nc-transplanted mice compared with Ba/F3-JAK2V617F-sh-lnc-ac#1-transplanted mice at 17 days after transplantation. n = 4 for each group. (D) HE staining of spleen from Ba/F3-JAK2V617F-sh-nc – and JAK2V617F-sh-lnc-ac#1-transplanted mice. Bar scales represent 40 μm. (E) Kaplan-Meier curves indicating the overall survival time in Ba/F3-JAK2V617F-sh-nc-and Ba/F3-JAK2V617F-sh-lnc-ac#1-transplanted mice (n = 8 for each group). ** P < 0.01; *** P < 0.001.