
Figures & data
Table 1. Comparison of basic clinical data between the MM and normal control groups [n (%) /M(P25-P75)]
Figure 1. Comparison of coagulation function indicators in different DS stages; *p < 0.05; **p < 0.01; ***p < 0.001.
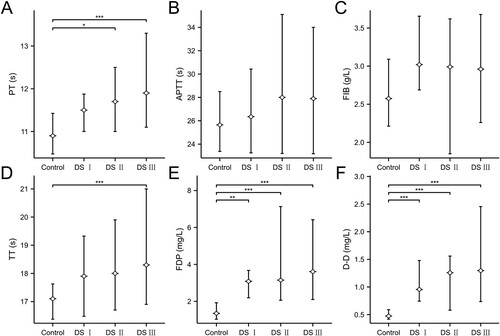
Table 2. Comparison of results of coagulation function indicators in different DS stages [n /M(P25–P75)].
Figure 2. Comparison of results of coagulation function indicators for different ISS stages. *p < 0.05; **p < 0.01; ***p < 0.001.
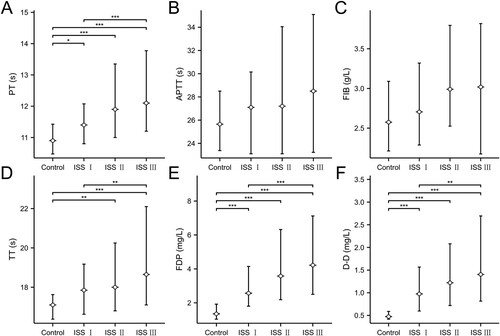
Table 3. Comparison of results of coagulation function indicators in different ISS stages [n /M(P25–P75)].
Table 4. Correlation of β2-MG with PT, APTT, FIB, TT, FDP, and D-D.
Figure 3. Comparison of coagulation function indicators for different M protein types. *p < 0.05; **p < 0.01; ***p < 0.001.
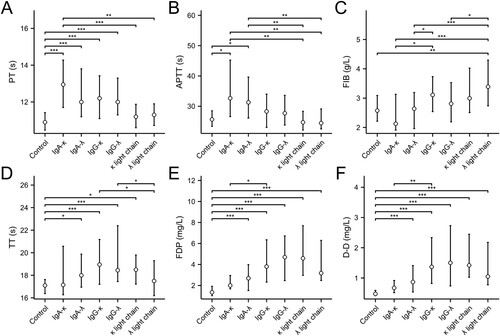
Table 5. Coagulation function indicator levels for different M protein types [n /M(P25-P75)].