
Figures & data
Figure 1. Bone marrow smear findings at high magnification (A and B) and low magnification (C), as well as preliminary bone marrow flow cytometry results (D) at the patient’s initial consultation. (A–C) The bone marrow was actively proliferating, granulocyte-red ratio of 0.38/1 with an inverted ratio; the lymphocyte lineage accounted for 88.5%, with an extremely high proportion, and cells of all stages were detected, with a predominance of lymphoblasts, accounting for a total of 86%. (D) Flow cytometry of the bone marrow showed a normal lymphocyte population (cluster Y, green). Blasts population (cluster X) occupying approximately 86.62% of the nucleated cells, which expressed CD34, CD19, CD10, cCD79a, HLA-DR, CD33 (partially), and did not express CD117, CD13, CD56, CD5, CD7, CD3, CD2, CD64, CD14, CD38, CD20, CD16, CD11b, cCD3, cMPO.
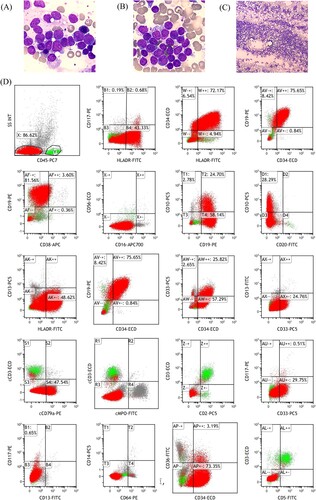
Figure 2. Sanger sequencing peaks of TP53 c.848G>A (p.Arg283His) mutation detection in the patient (A) and her relatives (B).
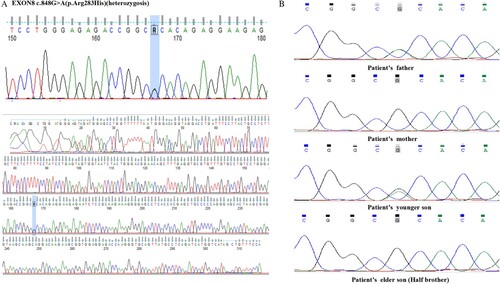
Figure 3. Genetic profile of the patient with TP53 c.848G>A (p.Arg283His) mutations.
Note: In F3, the number ‘1’ and ‘2’ mean the son A and the son B, respectively.
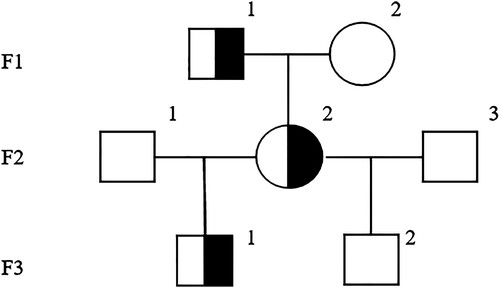
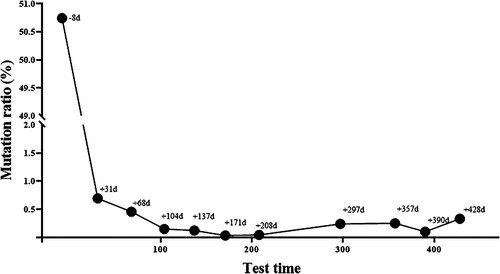
Figure 4. Quantitative monitoring of bone marrow TP53 c.848G>A (p.Arg283His) in the patient after allo-HSCT. Allo-HSCT, allogeneic hematopoietic stem cell transplantation.
Data availability statement
All data generated or analyzed during this study are included in this article. Further enquiries should be directed to the corresponding author.