17,577
Views
18
CrossRef citations to date
0
Altmetric
Special Section: China and the World Economy: Special Section for the 10th Biennial Conference of Hong Kong Economic Association

Impact of the Belt and Road Initiative on China’s soft power: preliminary evidence

&

Figures & data

Table 1. Descriptive Statistics.

Figure 1. China’s ODI and Soft Power: 2011–2016.

Note: The vertical axis refers to the Pew International Poll of Soft Power of China perceived by host country and the horizontal axis is China’s ODI in host country. The period is from 2011 to 2016.

Figure 1. China’s ODI and Soft Power: 2011–2016.Note: The vertical axis refers to the Pew International Poll of Soft Power of China perceived by host country and the horizontal axis is China’s ODI in host country. The period is from 2011 to 2016.

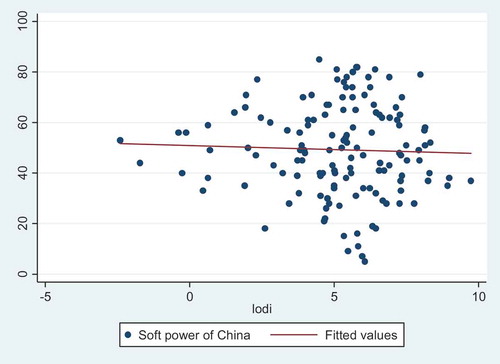
Table 2. Changes of China’s Soft Power due to the Belt and Road Initiative.

Table 3. Effects of ODI on China’s Soft Power.

Table 4. Impacts of Investment on BRI countries on China’s Soft Power.

Table 5. China’s BRI and Soft Power: Differential Impacts along the Belt and Road.

Reprints and Corporate Permissions

Please note: Selecting permissions does not provide access to the full text of the article, please see our help page How do I view content?

To request a reprint or corporate permissions for this article, please click on the relevant link below:

Academic Permissions

Please note: Selecting permissions does not provide access to the full text of the article, please see our help page How do I view content?

Obtain permissions instantly via Rightslink by clicking on the button below:

If you are unable to obtain permissions via Rightslink, please complete and submit this Permissions form. For more information, please visit our Permissions help page.