
Figures & data
Table 1: Characteristics of the study group
Table 2: Description of the lipid profile
Figure 1: Lipids at target.
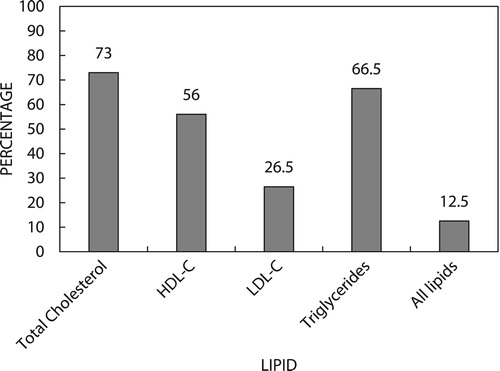
Table 3: Statin therapy according to intensity
Table 4: Correlation of HBA1C and lipid profile.
Table 5: Breakdown of HBA1C
Table 6: Weight ≥ 100kg, lipid profile and HBA1C
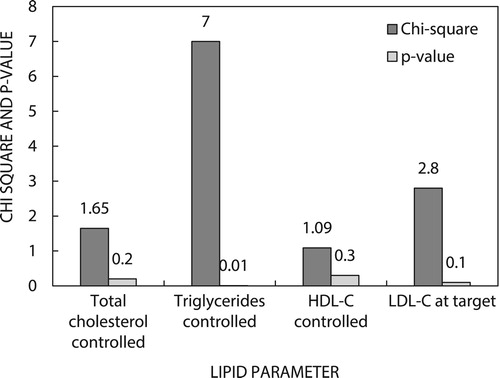
Figure 2: Correlation of controlled/at-target lipids for participants with HBA1C < 7%.
Supplemental material