Figures & data
Table 1: Clinical and laboratory characteristics of the individual-patient-level follow-up (IPLF) study group (n = 58) evaluated at three time points (2006, 2012, 2015)
Figure 1: Glycaemic and non-glycaemic parameters in the individual-patient-level follow-up (IPLF) study group (n = 58) according to study year. P-values are for comparisons between the three groups by McNemar’s chi-square test for pairs of categorical variables. ap < 0.01, bp < 0.001 vs. 2006.
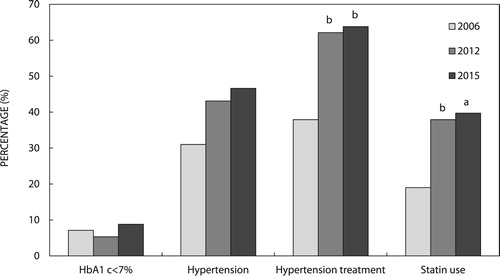
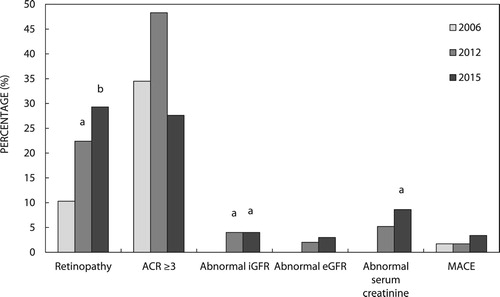
Figure 2: Chronic complications in the individual-patient-level follow-up (IPLF) study (n = 58) according to study year. ACR: albumin creatinine ratio; iGFR: isotope glomerular filtration rate; eGFR: estimated glomerular filtration rate; MACE: major adverse cardiovascular event; p-values are for comparisons between the three groups by McNemar’s chi-square test for pairs of categorical variables. ap < 0.05, bp < 0.01 vs. 2006.