Figures & data
Table 1: Number of incidences, prevalence, deaths, YLDs, YLLs, DALYs, and corresponding age-standardised rates and change for T2D by sex in Saudi Arabia from 1990 to 2019
Figure 1. The proportion of DALYs due to T2D by age group in Saudi Arabia, by sex, 1990–2019. DALY: Disability-adjusted life years.
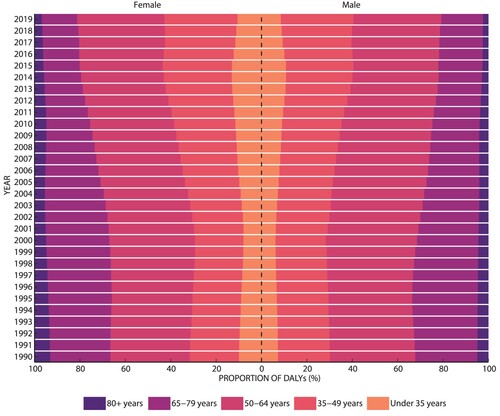
Figure 2. Decomposition of the type 2 diabetes burden in Saudi Arabia between 1990 and 2019.
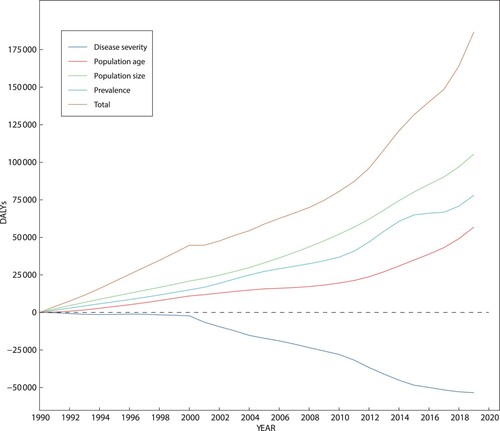
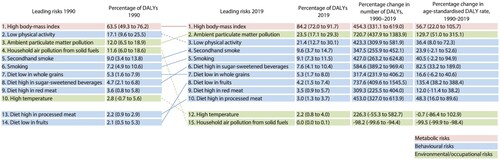
Figure 3. DALYs due to type 2 diabetes risk factors in Saudi Arabia 1990–2019. DALY: Disability-adjusted life years. The line connecting the boxes refers to changes in the ranking of risk factors, with the solid line indicating an increase in the ranking of the burden of disease due to risk factors and the dashed line indicating a decrease in the ranking of the burden of disease due to risk factors.