
Figures & data
Figure 1. The hypothesised study-sports spillover model. Note: Dashed squares indicate observed variables based on factor scores.
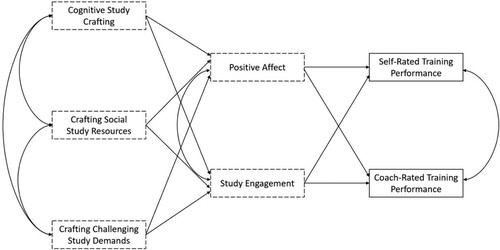
Table 1. Step 1: goodness-of-fit statistics for confirmatory factor analyses of the measurement models.
Table 2. Means, standard deviations, and correlations of the study variables.
Figure 2. Step 2: path model of the study-sports spillover model. Notes: Path coefficients are presented as standardised coefficients, standard errors in parentheses. Dashed squares indicate observed variables based on factor scores. *p < .05, **p < .01, ***p < .001.
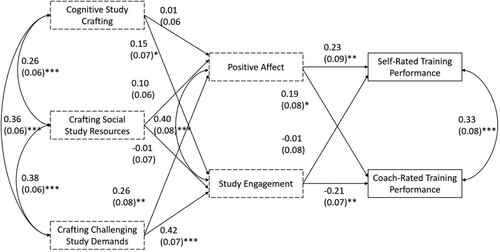
Table 3. Results of the bootstrapped standardised indirect effects.
Figure A1. Visual representation of Step 1 measurement model of cognitive study crafting.
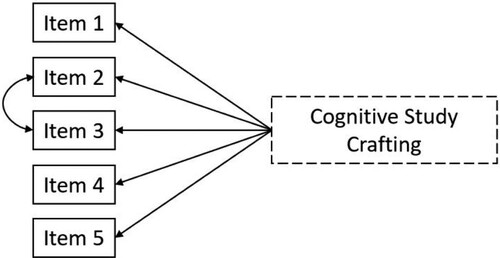
Figure A2. Visual representation of Step 1 measurement model of crafting social study resources.
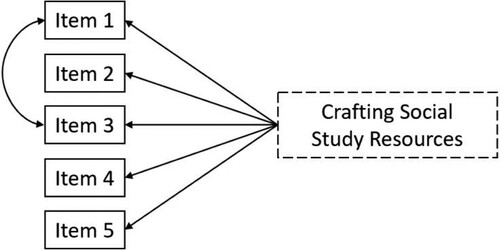
Figure A3. Visual representation of Step 1 measurement model of crafting challenging study demands.
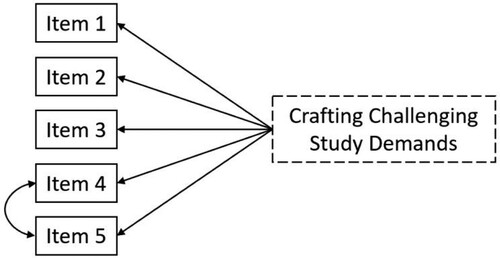
Figure A4. Visual representation of Step 1 measurement model of positive affect.
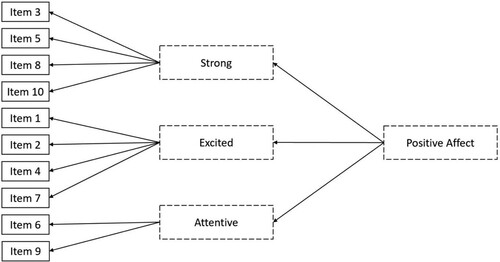
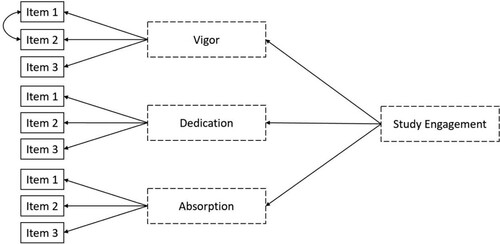
Figure A5. Visual representation of Step 1 measurement model of study engagement.
Data availability statement
The data and R scripts are available upon request from the corresponding author.