
Figures & data
Figure 1. PRISMA (preferred reporting items for systematic reviews and meta-analysis) chart of search strategy.
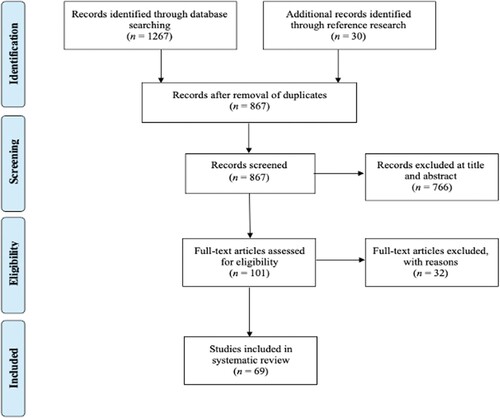
Table 1. Summary of all studies that were included (n = 69).
Table 2. Frequency distribution of moderators and variables in all included studies (and sub-studies).
Table 3. Quality assessment of included studies.
Figure 2. Main p-curve distribution of 44 statistically significant results (blue solid lines), compared to the expected distribution when the null hypothesis is true (red dotted lines) or the alternative hypothesis is true and studies were powered at 33% (green striped lines).
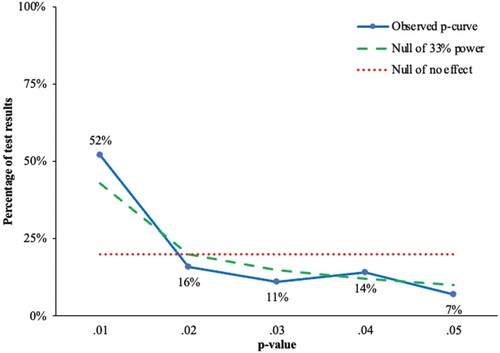
Figure 3. Robustness test of 32 statistically significant results (blue solid1 lines), compared to the expected distribution when the null hypothesis is true (red dotted lines) or the alternative hypothesis is true and studies were powered at 33% (green striped lines).
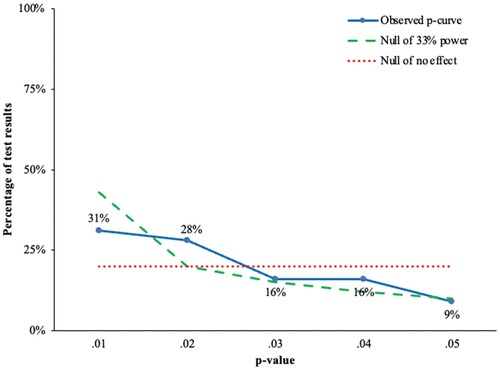
Table 4. Overall random effects model.
Table 5. Moderator analysis of Hedge’s g for the effect of colour.