
Figures & data
Figure 1 . The Impact of Calligraphy Practice on Athletes’ Persistent Self-control.
Note. Significant difference between groups is indicated by # and significant effects are indicated by *. Error bars represent ± 1 SE.
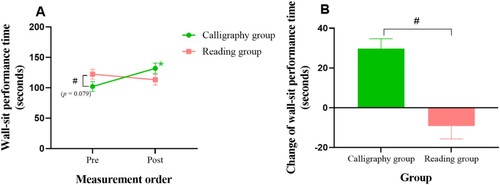
Table 1 . Descriptive statistics of athletes’ persistent self-control (M ± SD).
Figure 2 . The Impact of Calligraphy Practice on Athletes’ Emotion.
Note. Significant difference between groups is indicated by # and significant effects are indicated by *. Error bars represent ± 1 SE.
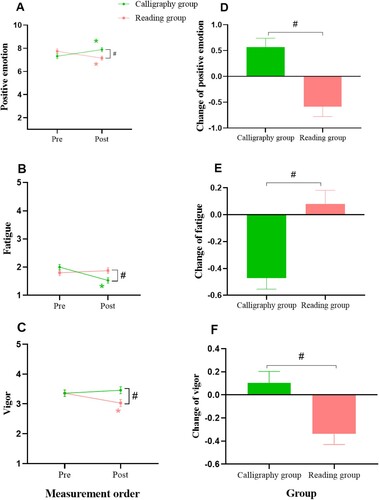
Table 2 . Descriptive statistics of athletes’ emotions (M ± SD).
Figure 3 . The Impact of Calligraphy Practice on Athletes’ Inhibitory Self-control.
Note. Significant difference between groups is indicated by # and significant effects are indicated by *. Error bars represent ± 1 SE.
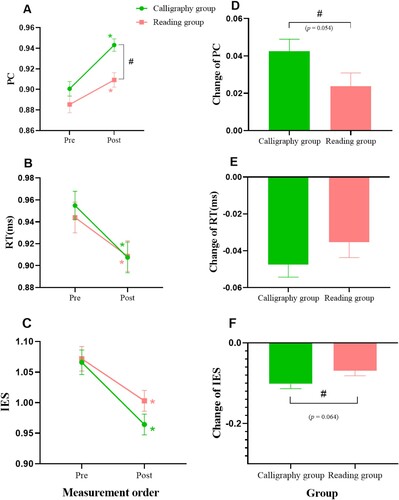
Table 3 . Descriptive statistics of athletes’ inhibitory self-control (M ± SD).
Table 4 . Descriptive statistics of athletes’ emotion (M ± SD).