Figures & data
Figure 1. Bridge management system outline.
Figure 2. A bridge fuzzy number.
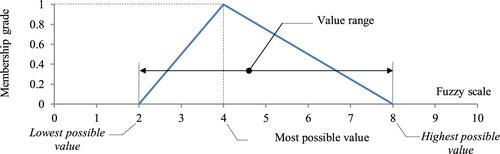
Table 1. The effective factors of bridge maintenance prioritisation.
Figure 3. Research methodology framework.
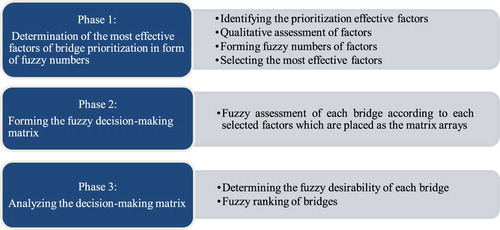
Table 2. Frequency chart for the importance degree of a surveyed parameter.
Figure 4. Converting a normal distribution function to isosceles TFN.
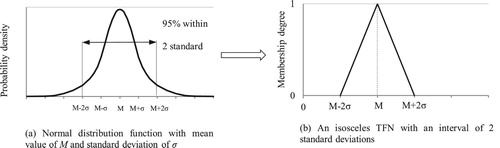
Figure 5. Continuous diagram of frequency for parameter importance degree based on a ten grade scale.
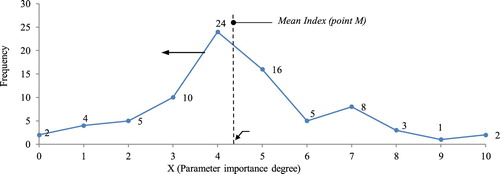
Figure 6. Corresponding TFN of parameter importance grade based on a ten grade evaluating scale.
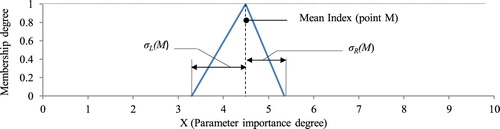
Table 3. The results of the proposed algorithm for calculating the lower and upper limits of the sample parameter.
Figure 7. Fuzzy singleton in 100% certainty state.
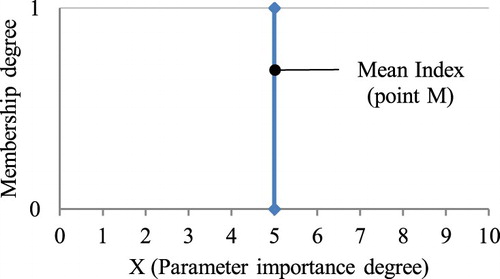
Figure 8. Selection the most effective parameters based on minimum fuzzy desirability of 50%.
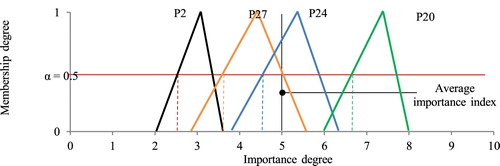
Table 4. Fuzzy desirability determination matrix [Citation18].
Figure 9. Schematic diagram of fuzzy desirability determination of an item using different cuts of α.
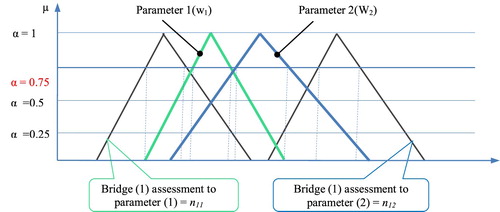
Figure 10. (α) Variation.
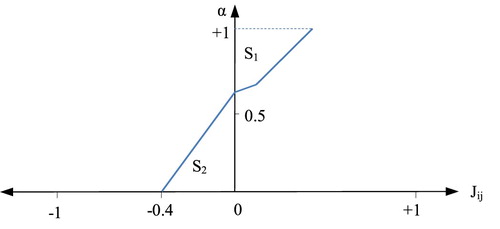
Figure 11. Schematic diagram of bridge fuzzy ranking.
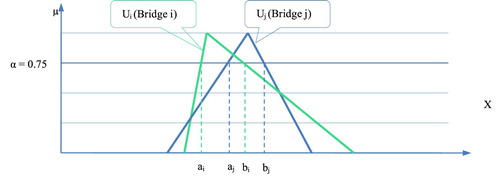
Figure 12. Distribution of (α) on one side of the (α) axis.
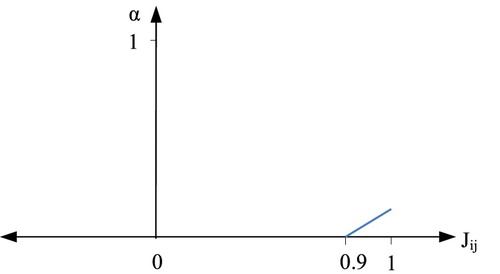
Figure 13. Distribution of (α) on both sides of the (α) axis.
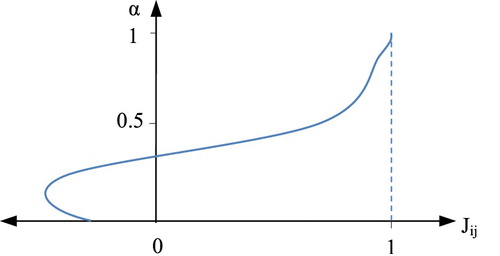
Figure 14. Part of parameters’ preference and non-preference matrix.
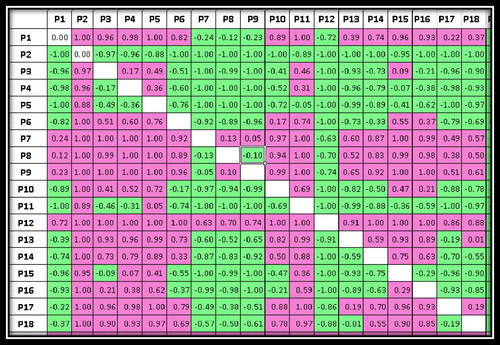
Figure 15. Part of preference or non-preference comparison matrix of bridges.
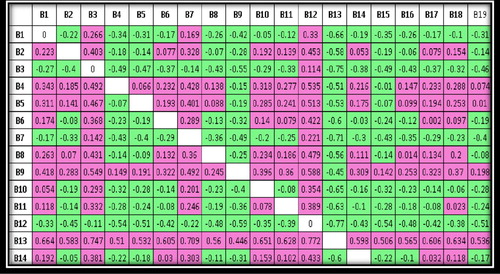
Figure 16. Factors ranking diagrams based on fuzzy approach and Friedman test method.
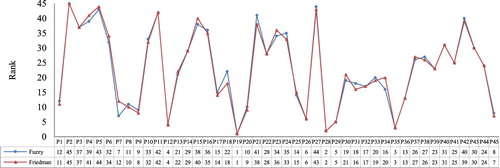
Figure 17. Selection method of the most effective factors ranked by using Friedman test.
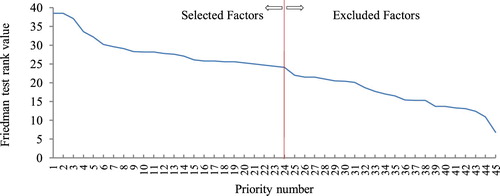
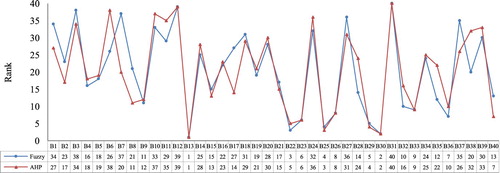
Figure 18. Bridge ranking diagrams using fuzzy approach and AHP method.