
Figures & data
Table 1. Information system.
Figure 1. The proposed research design.
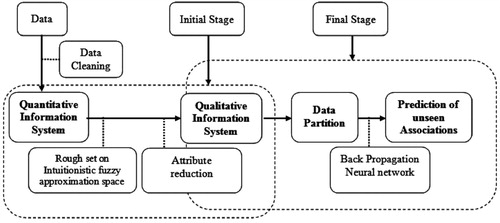
Figure 2. Design of back propagation neural network.
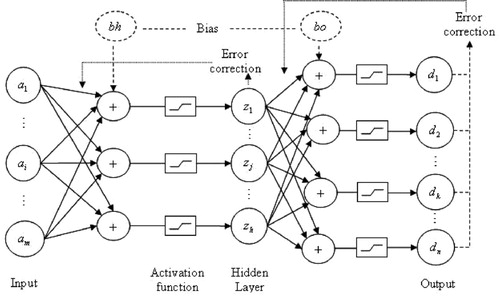
Figure 3 Index map of the study area.
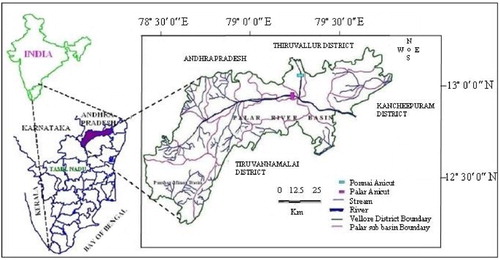
Figure 4. Administrative blocks of the study area.
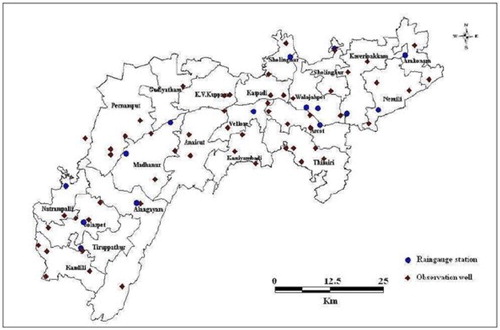
Table 2. Agricultural divisions in Vellore district
Table 3. Notation representation table
Table 4. Sample agriculture information system
Table 5. Intuitionistic fuzzy tolerance relation for the attribute a1
Table 6. Intuitionistic fuzzy proximity relation for the attribute a2
Table 7. Qualitative information system of sample dataset
Figure 5. Number of hidden nodes using MSE.
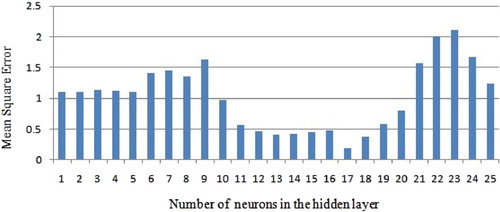
Figure 6. Number of hidden nodes using MPE.
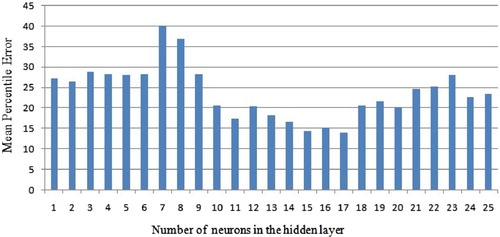
Table 8. Validating the training data
Table 9. Comparative analysis and results.
Figure 7. Experimental comparative graph.
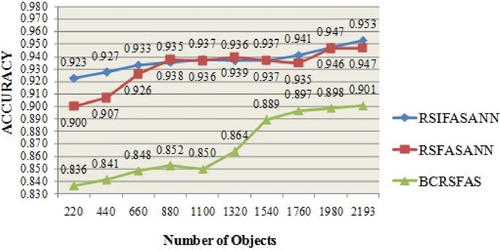
Figure 8. Mean square error of Fold 1 for N = 10.
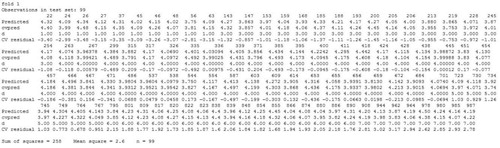
Figure 9. Overall mean square error over all folds for N = 10.
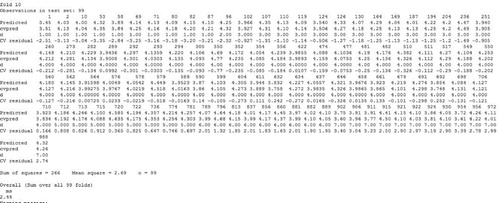
Table 10. Overall mean square error across various folds