
Figures & data
Figure 1. The buyer's inventory level versus time.
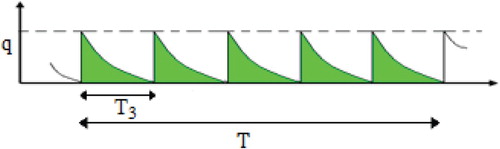
Figure 2. The supplier's inventory level versus time.
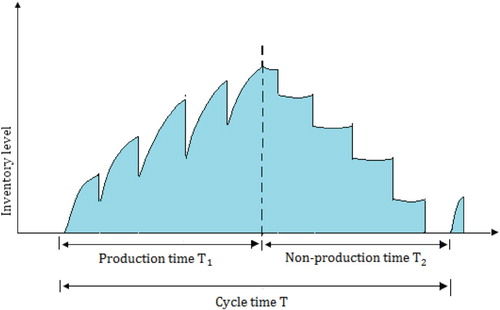
Figure 3. Triangular fuzzy number .
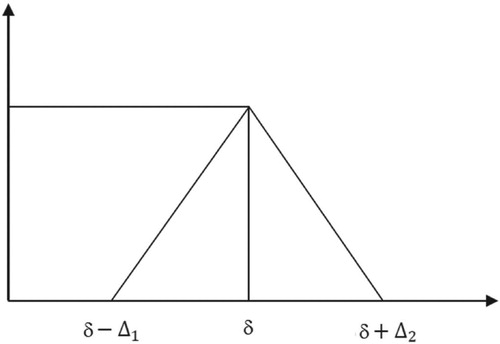
Figure 4. Triangular fuzzy number.
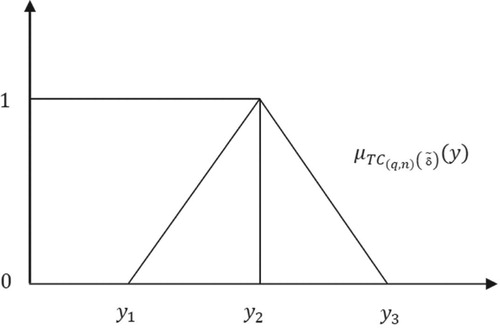
Figure 5. Optimality of the algorithm for the given example. (a) Effects of D on average total cost (b) Effects of P on average total cost; (c) Effects of Hs on average total cost (d) Effects of Hb on average total cost; (e) Effects of C on average total cost (f) Effects of A on average total cost; (g) Effects of F on average total cost (h) Effects of Cd on average total cost.
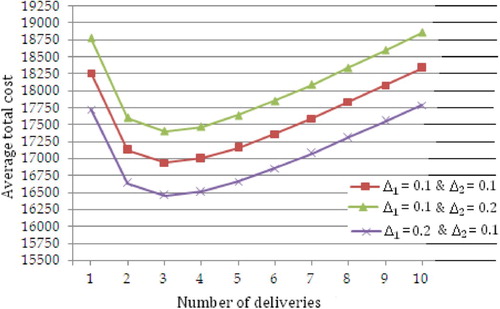
Table 1. Solution procedure of the model.
Figure 6. Percentage changes of parameters on the average total cost.
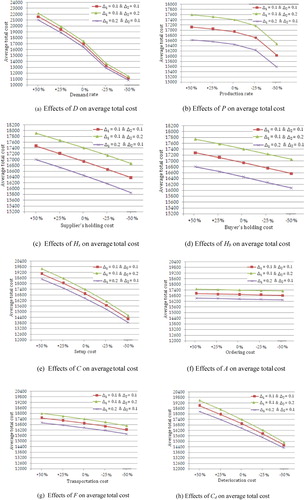
Table 2. Effects of on optimal solution.
Table 3. Effects of on optimal solution.
Table 4. Effects of on optimal solution.
Table 5. Effects of on optimal solution.
Table 6. Effects of on optimal solution.
Table 7. Effects of on optimal solution.
Table 8. Effects of on optimal solution.