Figures & data
Figure 1. The hexagonal fuzzy numbers of example 2.3.1.
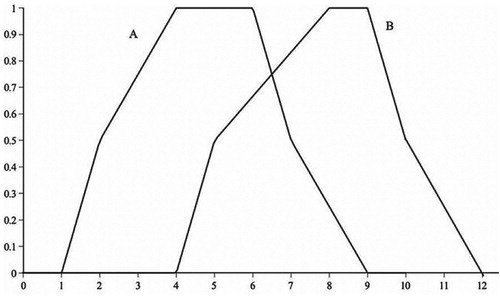
Figure 2. The red graph based on the extension principle (α-cut). The black graph is based on the transmission average.
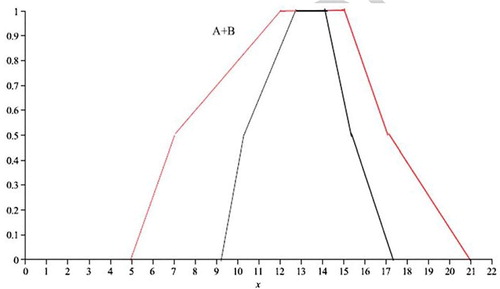
Figure 3. The red graph based on the extension principle (α-cut). The black graph is based on the transmission average.
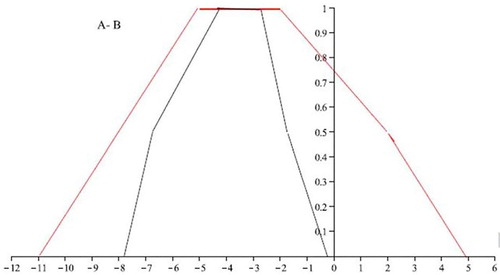
Figure 4. The red graph based on the extension principle (α-cut). The black graph is based on the transmission average.
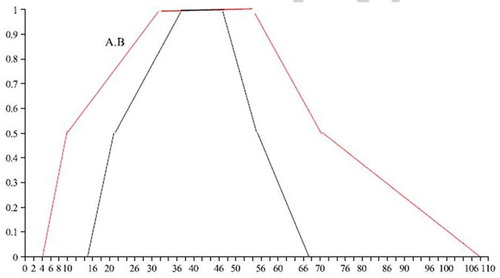
Figure 5. The red graph based on the extension principle (α-cut). The black graph is based on the transmission average.
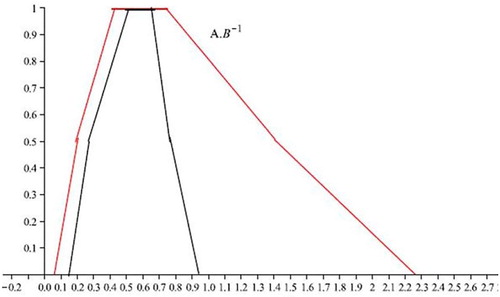
Figure 6. Configuration of a serial system.
Figure 7. Configuration of a parallel sysytem.
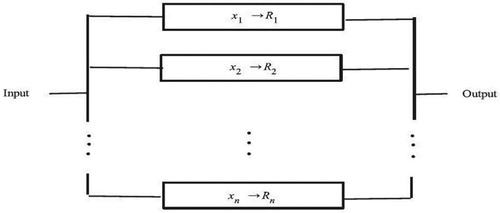
Figure 8. Marine Power Plant.
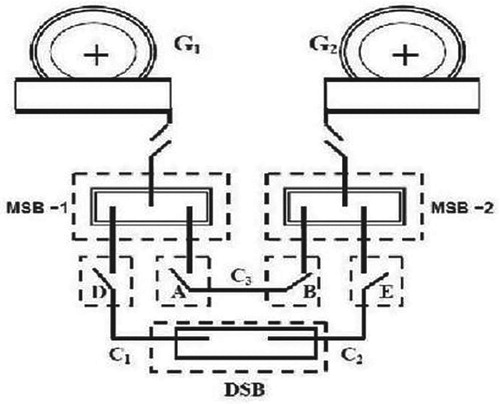
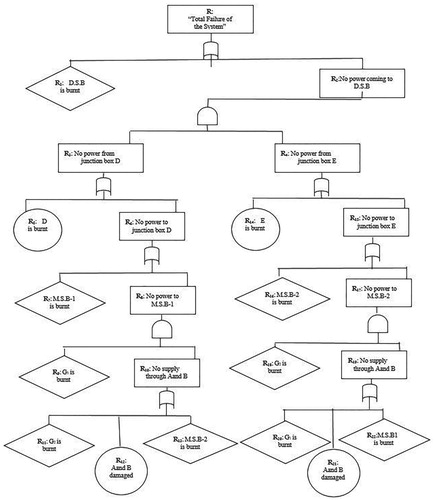
Figure 9. Fault tree of marine power plant.