
Figures & data
Figure 1. Flowchart of FSs, SSs, and their generalisation.
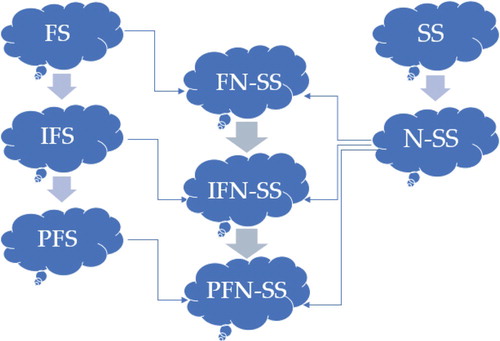
Table 1. Information obtained from the associated data.
Table 2. The tabular form of 5-SS.
Table 3. The tabular representation of the picture fuzzy 5-soft set in Example 1.
Table 4. Information obtained from the associated data.
Table 5. The tabular form of 5-SS.
Table 6. The tabular representation of the picture fuzzy 4-soft set in Example 2.
Table 7. The tabular representation of the PF4-SS assumed in Example 3.
Table 8. The tabular representation of the PF5-SS assumed in Example 3.
Table 9. The tabular representation of the PF5-SS assumed in Example 4.
Table 10. The tabular representation of the PF5-SS provided in Example 4.
Table 11. The tabular representation of the PF5-SS provided in Example 5 which is efficient.
Table 12. The picture fuzzy weak complement of PF5-SS in Example 1.
Table 13. The top picture fuzzy weak complement of PF5-SS in Example 1.
Table 14. The bottom picture fuzzy weak complement of PF5-SS in Example 1.
Table 15. The tabular form of PF5-SS of Example 9.
Table 16. The tabular form of PF6-SS of Example 9.
Table 17. The restricted intersection of and
.
Table 18. The restricted union of and
.
Table 19. The extended intersection of and
.
Table 20. The extended union of and
.
Table 21. The tabular form of PFSS is associated with threshold 1.
Table 22. The tabular form of PFSS is associated with threshold 2.
Table 23. The tabular form of PFSS is associated with threshold 3.
Table 24. The tabular form of PFSS is associated with threshold 4.
Figure 2. The flowchart of algorithm defined in Section 4.1.
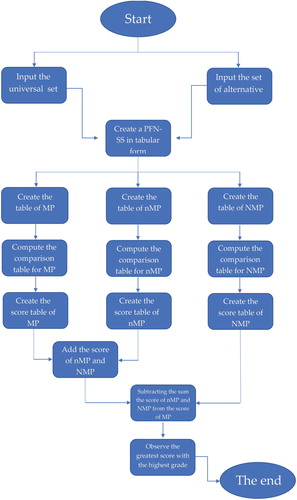
Table 25. The tabular form of MP in Example 14.
Table 26. The comparison table for MP in Example 14.
Table 27. The score table for MP in Example 14.
Table 28. The tabular representation of nMP in Example 14.
Table 29. The comparison table for nMP in Example 14.
Table 30. The score table for nMP in Example 14.
Table 31. The tabular representation of NMP in Example 14.
Table 32. The comparison table for NMP in Example 14.
Table 33. The score table for NMP in Example 14.
Table 34. Add the score of nMP given in table (30) and NMP given in Table .
Table 35. Table of final score with grades linked with PF5-SS of Example 14.
Figure 3. The next generation firewall.
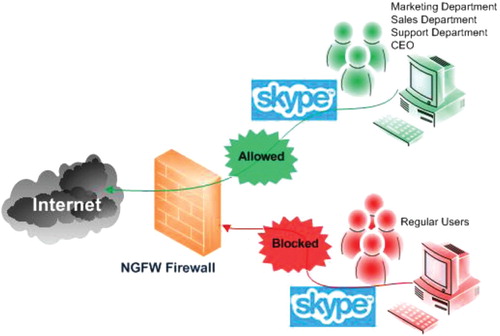
Table 36. Information obtained from associated data.
Table 37. The tabular form of 4-SS.
Table 38. The tabular representation of the picture fuzzy 4-soft set in Example 15.
Table 39. The tabular form of MP Example 15.
Table 40. The comparison table for MP in Example 15.
Table 41. The score table for MP in Example 15.
Table 42. The tabular representation of nMP in Example 15.
Table 43. The comparison table for nMP in Example 15.
Table 44. The score table for nMP in Example 15.
Table 45. The tabular representation of NMP in Example 15.
Table 46. The comparison table for NMP in Example 15.
Table 47. The score table for NMP in Example 15.
Table 48. Add the score of nMP given in table (44) and NMP given in Table .
Table 49. Table of final score with grades linked with PF6-SS of Example 15.
Table 50. Information obtained from the associated data.
Table 51. The tabular form of 5-SS.
Table 52. The tabular representation of IF5-SS in Example 16.
Table 53. The tabular representation of MP Example 16.
Table 54. The comparison table for MP in Example 16.
Table 55. The score table for MP in Example 16.
Table 56. The tabular representation of NMP in Example 16.
Table 57. The comparison table for NMP in Example 16.
Table 58. The score table for NMP in Example 16.
Table 59. Table of final score with grades linked with IF5-SS of Example 16.
Table 60. The tabular form of PF5-SS of Example 16.
Table 61. The tabular representation of MP in Example 16.
Table 62. The comparison table for MP in Example 16.
Table 63. The score table for MP in Example 16.
Table 64. The tabular form of nMP is given in Example 16.
Table 65. The comparison table for nMP in Example 16.
Table 66. The score table for nMP in Example 16.
Table 67. The tabular form of NMP given in Example 16.
Table 68. The comparison table for NMP in Example 16.
Table 69. The score table for NMP in Example 16.
Table 70. Add the score of nMP given in table (66) and NMP given in Table .
Table 71. Table of final score with grades linked with PF5-SS of Example 16.