
Figures & data
Figure 1. Evolution of revenues in the English Premier League.
Notes: Own figure based on Deloitte (Citation1998, Citation2013, Citation2016, Citation2019 , Citation2021). The figure displays the evaluation of total revenues for the three main revenue sources in the English Premier League from the season 2005/06 up to season 2019/20 in addition to total revenues in the founding season of the EPL 1991/92. The three major revenue sources are match day revenue, broadcasting revenue and commercial revenue.
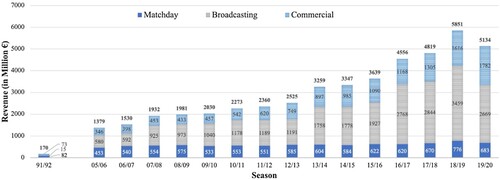
Figure 2. Match day revenues as a percentage of total revenues by club, 2018/19.
Notes: Own figure based on Quansah et al. (Citation2021). The figure displays match day revenues as a percentage of total revenues for each club that played in the English Premier League in the season 2018/19.
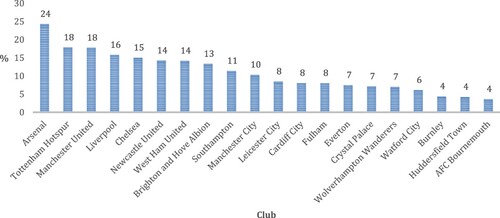
Table 1. EPL ticket price range for the 2018/19 season (in £).
Table 2. Summary Statistics for continuous and dummy variables (n = 1,520).
Table 3. Correlation matrix for independent variables (n = 1,520).
Table 4. Regression results: dependent variable is ln(ticket prices).
