
Figures & data
Table 1. Descriptive statistics for dependent variables. N = 856.
Figure 1. Histogram of goal scoring for the away team by control seasons or no home crowd/COVID-19 season.
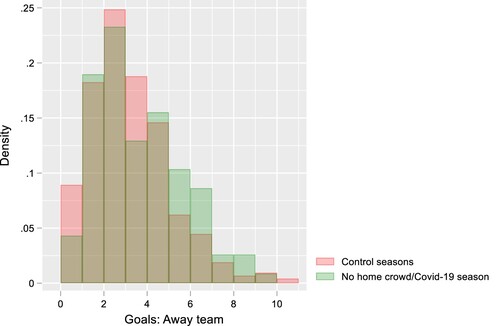
Figure 2. Histogram of suspensions for the home team by control seasons or no home crowd/COVID-19 season.
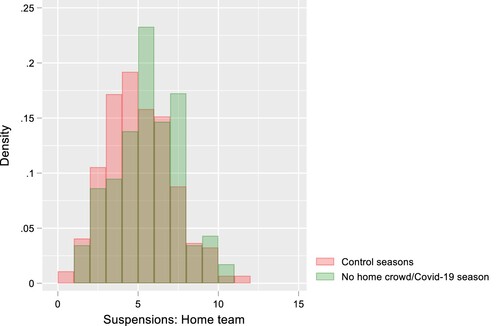
Table 2. Goal scoring by non-presence or presence of home crowd. Linear regression. N = 856.
Table 3. Suspensions by non-presence or presence of home crowd. Linear regression. N = 856.
Figure 3. Model of how home crowd presence or not affects goal scoring for away teams: directly as in (i) and indirectly through more suspensions for the home team, as in via (ii) and (iii).
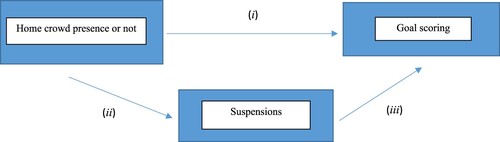
Table 4. Goal scoring for away teams and goal scoring difference between home and away teams by non-presence or presence of home crowd and number of suspensions. Linear regression. N = 856.