1,712
Views
0
CrossRef citations to date
0
Altmetric
Original Article

Angiopoietin-like protein 4 potentiates DATS-induced inhibition of proliferation, migration, and invasion of bladder cancer EJ cells; involvement of G2/M-phase cell cycle arrest, signaling pathways, and transcription factors-mediated MMP-9 expression

, , , , , , & show all
Article: 1338918 | Received 31 Jan 2017, Accepted 27 May 2017, Published online: 20 Jun 2017

Figures & data

Figure 1. DATS inhibits the proliferation of bladder cancer EJ cells via G2/M-phase arrest. (a, b) Cellular viability and proliferation were determined by both MTT assays and cell counting. (c) Images of EJ cells treated with different concentrations of DATS. (d–g) Cell cycle distribution of cells treated with 0 (d), 50 (e), 100 (f), and 150 μM of DATS (g). (h) The percentage of each population in cell cycle phase is presented. Results in bar graphs are expressed as the mean ± SE from three different triplicate experiments. *p < 0.05, vs. control.

Figure 1. DATS inhibits the proliferation of bladder cancer EJ cells via G2/M-phase arrest. (a, b) Cellular viability and proliferation were determined by both MTT assays and cell counting. (c) Images of EJ cells treated with different concentrations of DATS. (d–g) Cell cycle distribution of cells treated with 0 (d), 50 (e), 100 (f), and 150 μM of DATS (g). (h) The percentage of each population in cell cycle phase is presented. Results in bar graphs are expressed as the mean ± SE from three different triplicate experiments. *p < 0.05, vs. control.

Figure 2. Effects of DATS on the G2/M-phase cell cycle regulators and signaling pathways in EJ cells. (a) Protein expression changes induced by DATS were measured by immunoblotting using antibodies specific for the indicated proteins. The results were presented as a fold ratio to the expression of either total form or GAPDH. (b, c) Effects of DATS on MAPK (ERK1/2, JNK1/2, and p38 MAPK) and AKT were determined by immunoblotting. Results are expressed as fold changes compared to the expression of the control. (d) Cells were pre-incubated with U0126 (0.5 μM), SB203580 (10 μM), SP600125 (10 μM), and LY 294,002 (10 μM) for 40 min prior to DATS treatment (150 μM). The ratio of the phosphorylated to the un-phosphorylated form was measured and expressed as fold change compared to DATS treatment.

Figure 2. Effects of DATS on the G2/M-phase cell cycle regulators and signaling pathways in EJ cells. (a) Protein expression changes induced by DATS were measured by immunoblotting using antibodies specific for the indicated proteins. The results were presented as a fold ratio to the expression of either total form or GAPDH. (b, c) Effects of DATS on MAPK (ERK1/2, JNK1/2, and p38 MAPK) and AKT were determined by immunoblotting. Results are expressed as fold changes compared to the expression of the control. (d) Cells were pre-incubated with U0126 (0.5 μM), SB203580 (10 μM), SP600125 (10 μM), and LY 294,002 (10 μM) for 40 min prior to DATS treatment (150 μM). The ratio of the phosphorylated to the un-phosphorylated form was measured and expressed as fold change compared to DATS treatment.

Figure 3. DATS represses the migration and invasion of EJ cells through decreased MMP-9 expression by suppressing of the binding of Sp-1, AP-1, and NF-κB. (a) Wound-healing ability of EJ cells under DATS treatment was assessed by migration assays. The recovery rate was measured as a fold change as compared to the control. (b) Invasion of EJ cells were investigated by invasion assays using Matrigel®-coated chambers. The amount of invading cells was presented as a fold difference relative to the control. (c) Activities of MMP-2 and 9 were assessed by zymography using cell culture medium from DATS-treated cells. Protease activity of each MMP was measured as a fold change compared to the untreated control. (d) The activation of AP-1, Sp-1, and NF-κB was measured by EMSA. Binding activity of transcription factors under each condition was compared to the untreated control and presented as a fold change. Results in bar graphs are presented as the mean ± SE from three different triplicate experiments.

Figure 3. DATS represses the migration and invasion of EJ cells through decreased MMP-9 expression by suppressing of the binding of Sp-1, AP-1, and NF-κB. (a) Wound-healing ability of EJ cells under DATS treatment was assessed by migration assays. The recovery rate was measured as a fold change as compared to the control. (b) Invasion of EJ cells were investigated by invasion assays using Matrigel®-coated chambers. The amount of invading cells was presented as a fold difference relative to the control. (c) Activities of MMP-2 and 9 were assessed by zymography using cell culture medium from DATS-treated cells. Protease activity of each MMP was measured as a fold change compared to the untreated control. (d) The activation of AP-1, Sp-1, and NF-κB was measured by EMSA. Binding activity of transcription factors under each condition was compared to the untreated control and presented as a fold change. Results in bar graphs are presented as the mean ± SE from three different triplicate experiments.

Figure 4. Gene expression patterns of EJ cells induced by DATS. (a) Differential patterns of gene expression were identified by comparative microarray analysis of DATS-treated EJ cells versus untreated cells. The red and green colors indicate high and low gene expression, respectively. (b, c) Differentially expressed genes (2,285 genes) upon DATS treatments were classified by their biological processes (b) and molecular functions (c).

Figure 4. Gene expression patterns of EJ cells induced by DATS. (a) Differential patterns of gene expression were identified by comparative microarray analysis of DATS-treated EJ cells versus untreated cells. The red and green colors indicate high and low gene expression, respectively. (b, c) Differentially expressed genes (2,285 genes) upon DATS treatments were classified by their biological processes (b) and molecular functions (c).

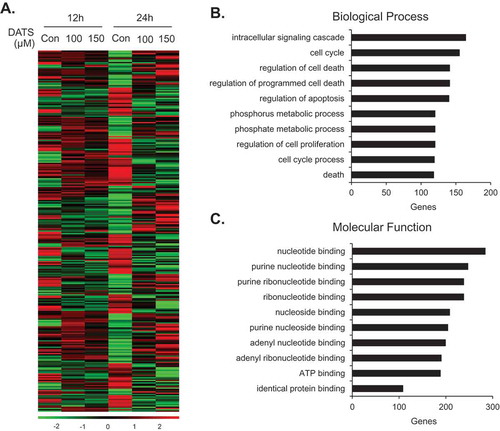
Table 1. The 10 most upregulated genes in the BP category following DATS treatment.

Table 2. The 10 most downregulated genes in the BP category following DATS treatment

Table 3. The 10 most upregulated genes in the MF category following DATS treatment

Table 4. The 10 most downregulated genes in the MF category following DATS treatment

Table 5. Upregulated genes following DATS treatment (150 μM)

Figure 5. ANGPTL4 enhances the DATS-induced inhibition of proliferation, migration, and invasion and induction of G2/M-phase cell cycle arrest in EJ cells. (a) The relative cell number was determined as a fold change compared to the control. (b) Images of cells under different transfection conditions as indicated were photographed under a phase contrast microscope. (c, d) After transfection, wound-healing capacity and invasiveness of EJ cells under the indicated conditions were presented as a fold change compared to the control. (E-N) After transfection with either ANGPTL4 or an empty vector (EV), changes in the cell-cycle phase distribution in response to DATS were analyzed by flow cytometry. The results in bar graphs are presented as the mean ± SE from three different triplicate experiments. *p < 0.05, vs. control and **p < 0.05, vs. DATS treatment.

Figure 5. ANGPTL4 enhances the DATS-induced inhibition of proliferation, migration, and invasion and induction of G2/M-phase cell cycle arrest in EJ cells. (a) The relative cell number was determined as a fold change compared to the control. (b) Images of cells under different transfection conditions as indicated were photographed under a phase contrast microscope. (c, d) After transfection, wound-healing capacity and invasiveness of EJ cells under the indicated conditions were presented as a fold change compared to the control. (E-N) After transfection with either ANGPTL4 or an empty vector (EV), changes in the cell-cycle phase distribution in response to DATS were analyzed by flow cytometry. The results in bar graphs are presented as the mean ± SE from three different triplicate experiments. *p < 0.05, vs. control and **p < 0.05, vs. DATS treatment.

Figure 6. Effect of ANGPTL4 on the regulatory proteins participating in DATS-induced signaling cascades. EJ cells were transfected with either an EV (a, c) or ANGPTL4 cDNA (b, d) followed by incubation in either DATS-containing (150 μM) or normal medium for 24 h. Changes in the protein expression levels as compared to the control were measured by immunoblotting using specific antibodies indicated. Expression was normalized to total forms or GAPDH. Relative fold changes as compared to the control are presented in the graph. *p < 0.05, vs. control and **p < 0.05, vs. DATS treatment.

Figure 6. Effect of ANGPTL4 on the regulatory proteins participating in DATS-induced signaling cascades. EJ cells were transfected with either an EV (a, c) or ANGPTL4 cDNA (b, d) followed by incubation in either DATS-containing (150 μM) or normal medium for 24 h. Changes in the protein expression levels as compared to the control were measured by immunoblotting using specific antibodies indicated. Expression was normalized to total forms or GAPDH. Relative fold changes as compared to the control are presented in the graph. *p < 0.05, vs. control and **p < 0.05, vs. DATS treatment.

Figure 7. ANGPTL4 potentiates the inhibitory activity of MMP-9 expression via the reduction of binding activities of AP-1, Sp-1, and NF-κB in DATS-treated EJ cells. Cells were transfected with either an EV or ANGPTL4 cDNA. Then, the cells were treated with DATS (150 μM) for 24 h. (a, b) Zymography for MMP-9 expression was carried out using cultured medium. Proteolytic activity of MMP-9 was measured as the fold change compared to the control. (c, d) Binding activities of AP-1, Sp-1, and NF-κB were measured by EMSA using radiolabeled oligonucleotide probes. As competitors, unlabeled AP-1, Sp-1, and NF-κB oligonucleotides were used. Relative fold changes were presented compared to the control. In each bar graph, results are presented as the mean ± SE from three different triplicate experiments. *p < 0.05, vs. control and **p < 0.05, vs. DATS treatment.

Figure 7. ANGPTL4 potentiates the inhibitory activity of MMP-9 expression via the reduction of binding activities of AP-1, Sp-1, and NF-κB in DATS-treated EJ cells. Cells were transfected with either an EV or ANGPTL4 cDNA. Then, the cells were treated with DATS (150 μM) for 24 h. (a, b) Zymography for MMP-9 expression was carried out using cultured medium. Proteolytic activity of MMP-9 was measured as the fold change compared to the control. (c, d) Binding activities of AP-1, Sp-1, and NF-κB were measured by EMSA using radiolabeled oligonucleotide probes. As competitors, unlabeled AP-1, Sp-1, and NF-κB oligonucleotides were used. Relative fold changes were presented compared to the control. In each bar graph, results are presented as the mean ± SE from three different triplicate experiments. *p < 0.05, vs. control and **p < 0.05, vs. DATS treatment.
Supplemental material

ZFNR_A_1338918_Supplemental_data.zip

Download Zip (1.1 MB)