
Figures & data
Figure 1. Flow chart over participants.
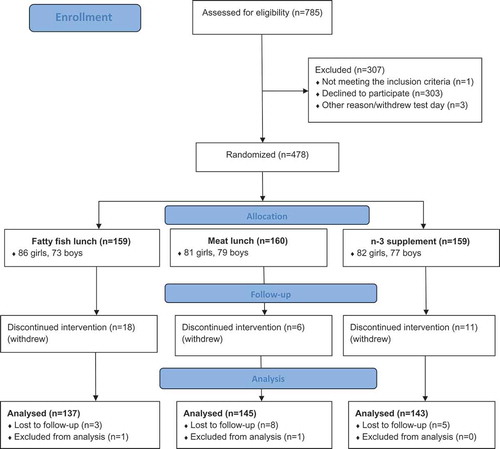
Table 1. Baseline characteristics of the study population and the different intervention groups.
Table 2. Predicted changes in SDQ scores after fish (n = 137), meat (n = 145) or supplement (n = 143) intervention, different models.
Table 3. Predicted changes in SDQ scores for participants with high SDQ scores at baseline after fish, meat or supplement intervention, different models.