
Figures & data
Figure 1. Flow chart for early infant diagnosis cascade among HIV-exposed babies eligible for PCR test (age <9 months at enrolment) under integrated HIV care program, Myanmar, 2013–2015.
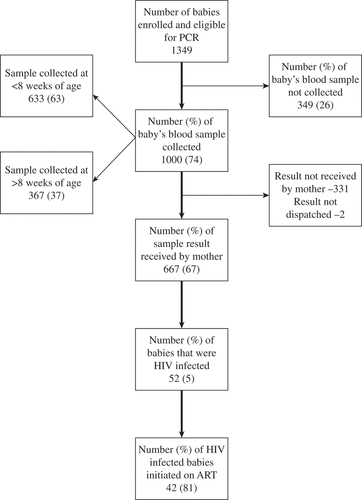
Table 1. Socio-demographic characteristics of HIV-exposed babies eligible for a PCR test (age <9 months at enrolment) under the integrated HIV care program, Myanmar, 2013–2015.
Table 2. Clinical and programmatic characteristics of HIV-exposed babies eligible for a PCR test (age <9 months at enrolment) under integrated HIV care program, Myanmar, 2013–2015.
Figure 2. Cumulative proportion of sample collected at different ages among HIV-exposed babies eligible for PCR test (age <9 months at enrolment) under integrated HIV care program, Myanmar, 2013–2015 (N = 1256)*.
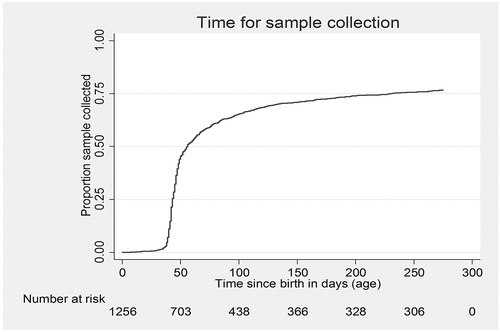
Table 3. Median age at enrolment /blood collection and turnaround time in EID cascade among HIV-exposed babies eligible for PCR test (age <9 months at enrolment) under integrated HIV care program, Myanmar, 2013–2015.
Table 4. Factors associated with delayed (≥8 weeks of age) or no blood sample collection among HIV-exposed babies eligible for PCR test (age <9 months at enrolment) under integrated HIV care program, Myanmar, 2013–2015.