
Figures & data
Figure 1. A theoretical conceptual framework of risk factors for obesity.
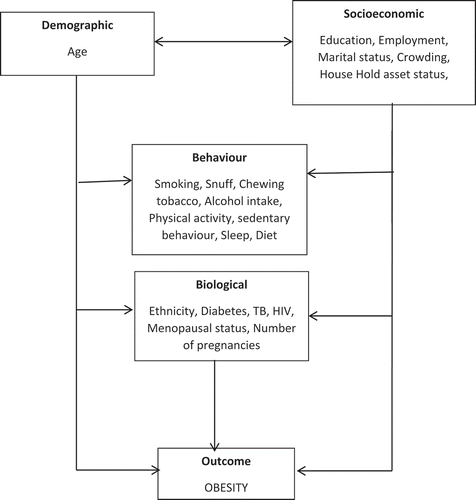
Table 1. Distribution of socio-demographic, behavioural and biological characteristics by sex.
Figure 2. Prevalence of overweight and obesity by ethnicity among men and women aged 40–60 years in the Nairobi slums (2015–2016).
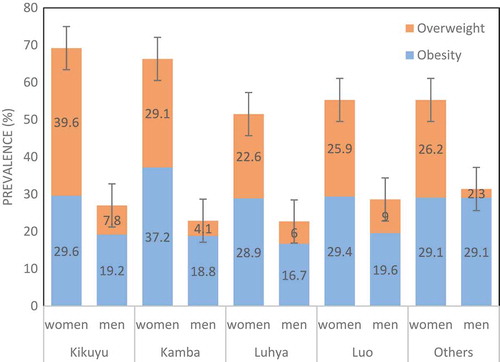
Table 2. Factors associated BMI among men and women in Nairobi slums (Univariate analysis).
Table 3. Factors associated with BMI among men aged 40–60 years in Nairobi slums (2014–2015).
Table 4. Factors associated with BMI among women aged 40–60 years in Nairobi slums (2014–2015).