
Figures & data
Table 1. Public Health Development Index (overall index and sub-indices): national and province averages, Indonesia, RISKESDAS, 2013.
Table 2. Relative within-province inequality (measured by Weighted Index of Disparity) in Public Health Development Index (overall index and sub-indices): Indonesia, RISKESDAS, 2013.
Figure 1. Public Health Development Index (overall), in 33 provinces, Indonesia, 2013.
Note: Data are not available for North Kalimantan province, which was created in 2012.
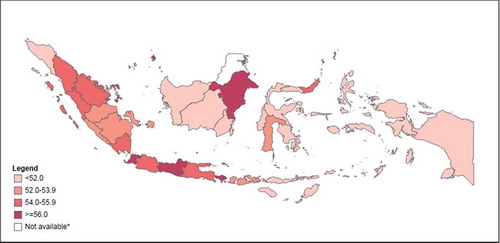
Figure 2. Public Health Development Index (overall), by district, in 33 provinces, Indonesia, 2013.
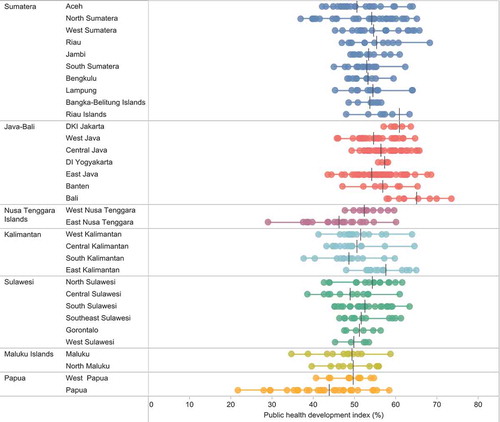
Figure 3. Relative within-province inequality in Public Health Development Index measured as Weighted Index of disparity, in 33 provinces, Indonesia, 2013.
Note: Data are not available for North Kalimantan province, which was created in 2012.
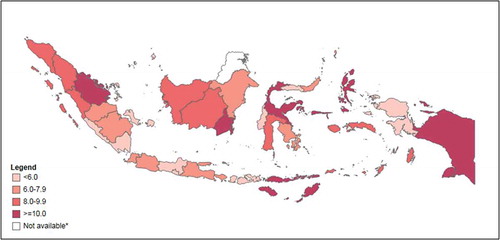
Figure 4. Public Health Development Index (overall index): province average and relative within-province inequality, Indonesia, RISKESDAS, 2013.
Note: Dashed orange lines indicate the median values.
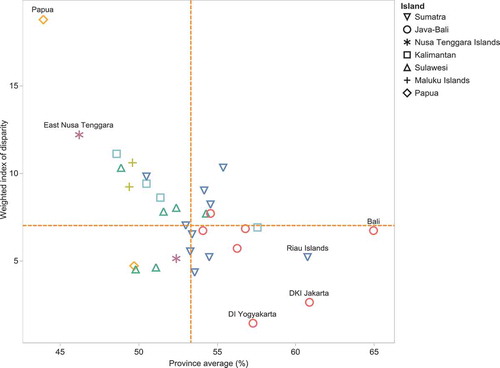
Figure 5. Sub-indices of Public Health Development Index: province average and relative within-province inequality, Indonesia, RISKESDAS, 2013.
Note: Dashed orange lines indicate the median values.
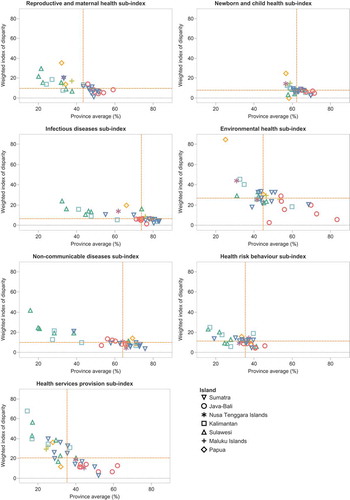
Table A1. Defining weighting factor for each indicator.
Table A2. Example of PHDI calculation for district ‘X’.