
Figures & data
Figure 1. Conceptual framework of delays in HIV care cascade, Myanmar, 2014–2016*.
HIV = human immunodeficiency virus, ART = anti-retroviral therapy
*Eligibility assessment delay and time spent in pre-ART care will not be applicable in a ‘test and treat’ setting (implemented since September 2017).
Figure 2. Flow chart on process of ART care for people living with HIV in ART clinics of the National AIDS Programme, Myanmar (2014–2016)*†.
HIV = human immunodeficiency virus, ART = anti-retroviral therapy; AIDS = acquired immunodeficiency syndrome; HBV = hepatitis B virus; HCV = hepatitis C virus; TB = tuberculosis; WHO = World Health Organization
*Box in pink colour is relevant during ‘test and treat’ strategy (implemented since September 2017). Box in white colour will not be relevant after introduction of ‘test and treat’ strategy.†Enrolled during 2014–2016 and followed up for ART initiation up to 5 December 2017; followed up until 31 March 2018 for attrition.
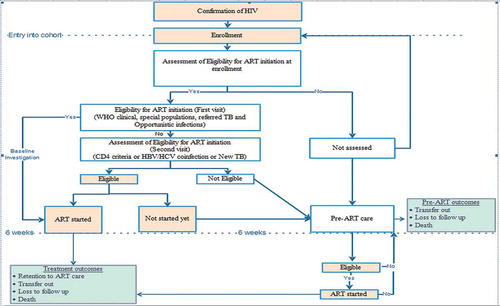
Table 1. Socio-demographic and clinical characteristics of people living with HIV enrolled at a public sector ART centre in Pyin Oo Lwin, Myanmar (2014–2016) (N = 543).
Table 2. Socio-demographic and clinical characteristics of people living with HIV initiated on ART at a public sector ART centre in Pyin Oo Lwin, Myanmar (2014–2016) (N = 373)†.
Table 3. Time taken (days) for ART initiation from HIV diagnosis among people living with HIV enrolled at a public sector ART centre in Pyin Oo Lwin, Myanmar (2014–2016).
Table 4. Factors associated with long time to ART* (≥ 30 days) after excluding the time interval in pre-ART care among people living with HIV initiated on ART at a public sector ART centre in Pyin Oo Lwin, Myanmar (2014–2016) (N = 373)†.
Table 5. Outcomes among people living with HIV initiated on ART at a public sector ART centre in Pyin Oo Lwin, Myanmar (2014–2016) (N = 373)†.
Table 6. Cumulative incidence of attrition rate among people living with HIV initiated on ART at a public sector ART centre in Pyin Oo Lwin, Myanmar (2014–2016) (N = 373)†.
Figure 3. Kaplan Meier survival curve^ among people living with HIV initiated on ART* at a public sector ART centre in Pyin Oo Lwin, Myanmar (2014–2016): overall and stratified by time to ART after excluding the delay in eligibility and/or time interval in pre-ART care*†.
HIV = human immunodeficiency virus, ART = anti-retroviral therapyLog rank test P value = 0.325, ^Event of interest is attrition which includes loss to follow-up and death.*Combination of enrolment delay and ART initiation delay, categorized based on the median value.†Enrolled during 2014–2016 and followed up for ART initiation up to 5 December 2017; followed up until 31 March 2018 for attrition.
Table 7. Confounder adjusted association between various delays before ART initiation and attrition (death and loss to follow-up) among people living with HIV initiated on ART at public sector ART centre in Pyin Oo Lwin, Myanmar (2014–2016) (N = 373)†.