
Figures & data
Figure 1. Study setting displaying included districts and health facilities, in Maputo and Gaza provinces, Mozambique.
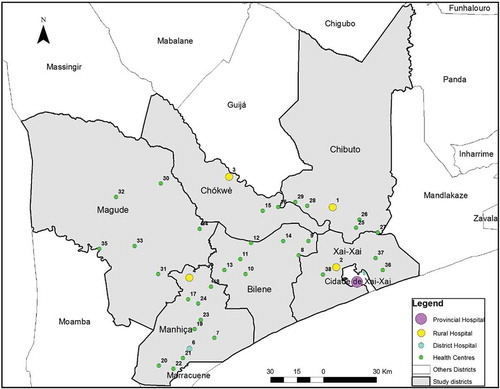
Table 1. Definitions of COACH dimensions.
Table 2. Analysis framework for the COACH tool response process in Mozambique.
Table 3. Demographic characteristics of the respondents (n = 175) in Maputo and Gaza provinces, 2016.
Table 4. Internal consistency of the COACH tool in Mozambique, 2016.
Table 5. Summary of context data for health workers individually and aggregated to district level using the COACH tool in Southern Mozambique, 2016.
Table A1. Type and magnitude of problems identified for items of the COACH tool in Mozambique and decisions made, 2016.
Table A2. Descriptive values of items and dimensions of the COACH tool in Mozambique, 2016.