
Figures & data
Video abstract
Figure 1. Our study area, Kandy district, on a map of Sri Lanka. Kandy district is shaded in light brown color in contrast to the other 24 districts. Location of the Katugastota weather stations from which we obtained our weather data is also depicted.
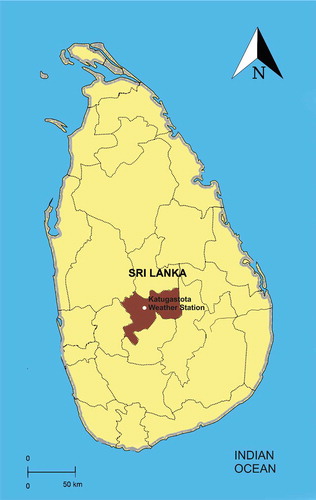
Figure 2. Changes of averages of weekly rain parameters and of average weekly leptospirosis incidence during the course of the year, for 2006–2015. Panel 2a: Changes of average of cumulated weekly rainfall (in millimeters) and of average weekly leptospirosis incidence (per 100,000 population) during the course of the year, for 2006–2015. x-axis: weeks/primary y- axis: average of cumulated weekly rainfall/secondary y-axis: average weekly leptospirosis incidence (per 100,000 population). Panel 2b: Changes of average count of wet days (days with rainfall > 1 mm) in a week and of average weekly leptospirosis incidence (per 100,000 population) during the course of the year, for 2006–2015. x-axis: weeks/primary y- axis: average of count of wet days per week/secondary y-axis: average weekly leptospirosis incidence (per 100,000 population).Panel 2c: shows the distribution 8 weeks with days with a rainfall > 100 mm and weekly leptospirosis incidences during the course of the 552 weeks of our study period. x-axis: week/primary y-axis: weeks with days with a rainfall > 100 mm/secondary y-axis: weekly leptospirosis incidence (per 100,000 population).
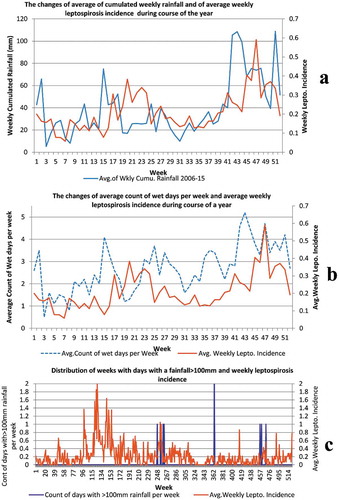
Figure 3. Panel 3a: Changes of average weekly temperature and of average weekly leptospirosis incidence during the course of the year, for 2006–2015. x-axis: weeks/primary y-axis: average weekly temperature (in C°)/secondary y-axis: average weekly leptospirosis incidence (per 100,000 population). Panel 3b: Changes of average of weekly minimum temperature and of average weekly leptospirosis incidence during the course of the year, for 2006–2015. x-axis: weeks/primary y- axis: average of weekly minimum temperature (in C°)/secondary y-axis: average weekly leptospirosis incidence (per 100,000 population). Panel 3c: Changes of average of weekly relative humidity and of average weekly leptospirosis incidence during the course of the year, for 2006–2015. x-axis: weeks/primary y- axis: average of weekly relative humidity (%)/secondary y-axis: average weekly leptospirosis incidence (per 100,000 population).
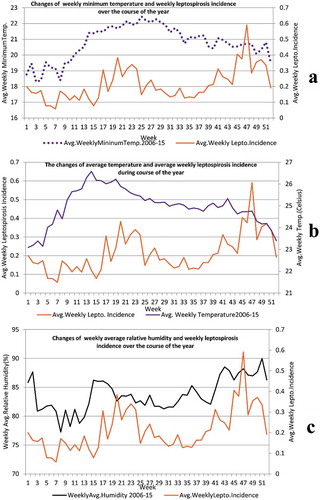
Figure 4. Results of wavelet analyses of weekly minimum temperature versus weekly leptospirosis incidence for 2006–2015: (Panel 4a) continuous wavelet transform (CWT) variations; (Panel 4b) wavelet power of CWT; (Panel 4c) crosswavelet transform (XWT) variations; (Panel 4d) wavelet power of XWT; (Panel 4e) wavelet coherence (WTC); (Panel 4f) wavelet power of WTC; and (Panel 4g) reconstructed time series for 2006–2015 period.
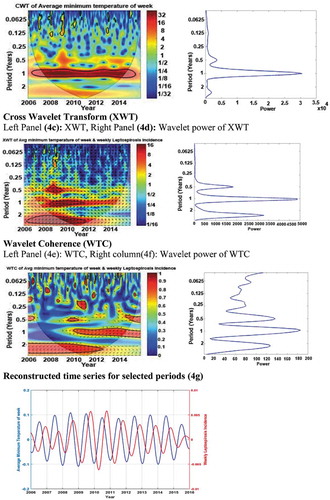
Table 1. Summary of the results of wavelet analysis.