Figures & data
Figure 1. Conceptual framework showing distal and proximate determinants of childhood mortality adopted from Mosley and Chen.
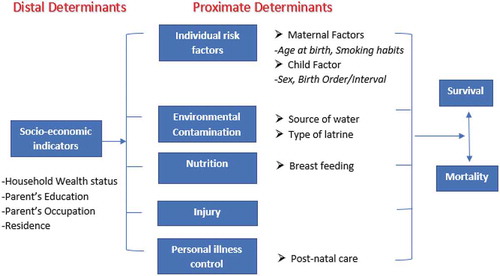
Table 1. Numbers and proportions of live births and deaths in the under-5, neonatal, post-neonatal and child periods by socioeconomic characteristics.
Figure 2.1. The concentration curve showing the distribution of under-5 deaths and numbers of live births ranked by household wealth.
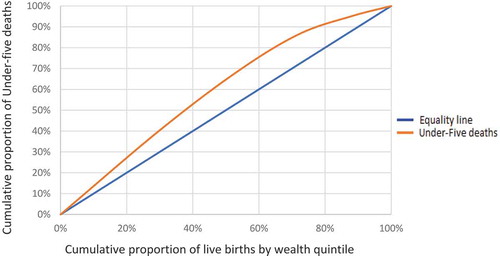
Figure 2.2. The concentration curve showing the distribution of under-5 deaths and numbers of live births ranked by highest attained parental education.
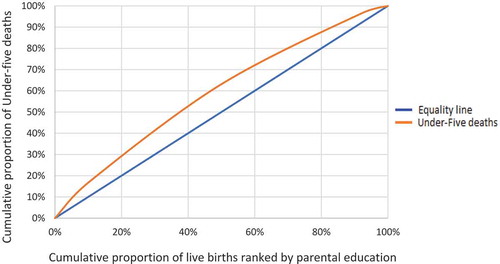
Table 2.1. Associations between household wealth and age-stratified early childhood mortality (neonatal, post-neonatal and child mortality).
Table 2.2. Associations between highest attained parental education level and age-stratified early childhood mortality (neonatal, post-neonatal and child mortality).
Figure 3.1. Associations between household wealth and under-5 mortality.
Note: Model A assessed the univariate association between household wealth index and each of the four mortality outcomes. Model B assessed the association between household wealth index and each of the four mortality outcomes considering also the individual proximate determinants (birth interval, birth order, mothers’ use of cigarettes/tobacco, maternal age at birth and sex of the child). Model C additionally adjusts Model B for the distal determinants (highest attained parental education, mothers’ occupation, fathers’ occupation and residence). Model D (sensitivity analysis) repeats Model B on a reduced data set that includes only records with non-missing values for the nutrition (breastfeeding) and personal illness control (postnatal care) variables. Model E additionally adjusts Model D for nutrition (breastfeeding) and personal illness control (postnatal care) variables.* p < 0.05, ** p < 0.01, *** p < 0.001 Under-5 mortality: deaths between birth and five years of age.
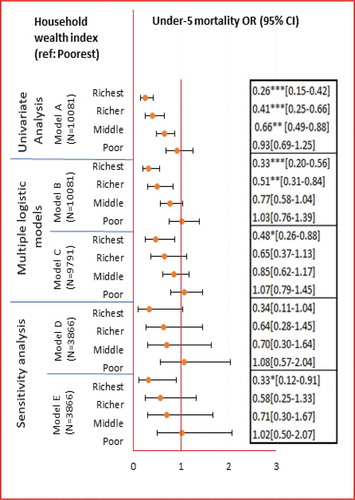
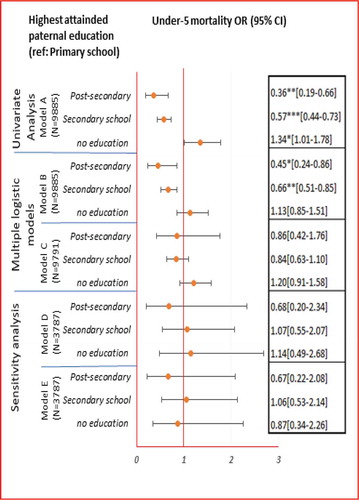
Figure 3.2. Associations between highest attained parental education and under-5 mortality.
Note: Model A assessed the association between highest attained parental education level and each of the four mortality outcomes. Model B assessed association between highest attained parental education level and each of the four mortality outcomes considering also the individual proximate determinants (birth interval, birth order, mothers’ use of cigarettes/tobacco, maternal age at birth and sex of the child). Model C additionally adjusts Model B for the distal determinants (household wealth index, mothers’ occupation, fathers’ occupation and residence). Model D (sensitivity analysis) repeats Model B on a reduced data set that includes only records with non-missing values for the nutrition (breastfeeding) and personal illness control (postnatal care) variables. Model E additionally adjusts Model D for nutrition (breastfeeding) and personal illness control (postnatal care) variables.* p < 0.05, ** p < 0.01, *** p < 0.001 Under-5 mortality: deaths between birth and five years of age.