
Figures & data
Table 1. Summary characteristics of full data set, publications and authors.
Table 2. Organisational affiliations of all authors (n = 1045) and in LIC with the most authors (n = 244).
Table 3. Distribution of publications and authorship by country income category per country of study (n = 1088*).
Figure 1. Distribution of authors by (a) country income (b) by country (n = 1045).
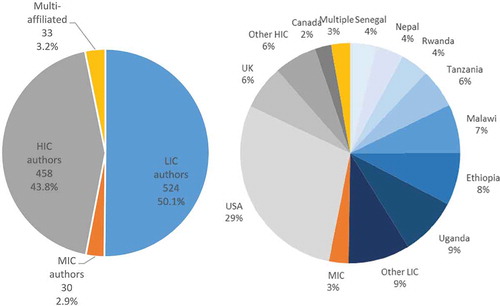
Figure 5. Distribution of country income class by the number of times lead or last authors (or both) cited (n = 309).
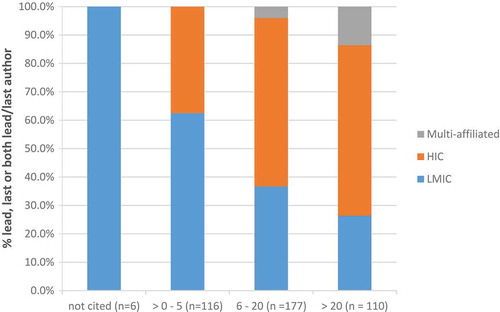
Figure 2. Co-authorship relationships by country; node size is number of authors affiliated in this country (given that a single paper can have multiple authors affiliated in multiple countries, papers are represented multiple times, depending on number of authors, making the nodes quantified by author X publication); the 3 single authored papers are excluded. Above shows all relationships; below shows all except north-south relationships.
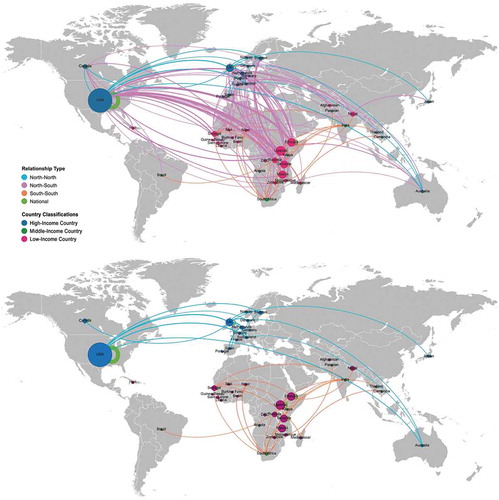
Figure 3. Co-author network with (a) node sized by betweenness and coloured by country of author affiliation and (b) nodes sized by citations per year and coloured by thematic area of study (n = 1045 authors).
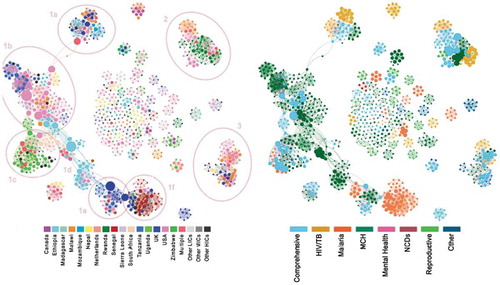
Figure 4. Institutional co-authorship networks – nodes sized by betweenness & coloured by country of affiliation (UNI = university; RI = research institute; UN = UN organisation; INGO = international NGO; MIN = Ministry of health).
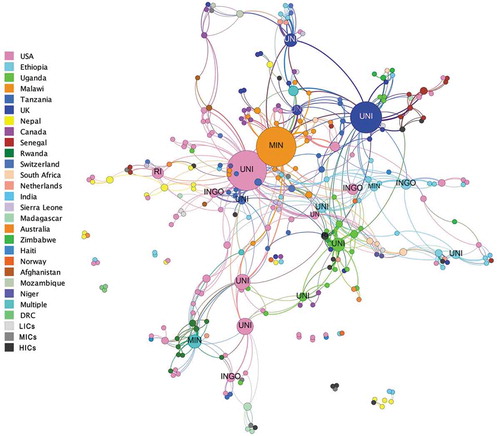
Table 4. Organisational rankings using various metrics.