1,611
Views
4
CrossRef citations to date
0
Altmetric
Original Article

Evaluating concordance between government administrative data and externally collected data among high-volume government health facilities in Uttar Pradesh, India

, , , ORCID Icon, &
Article: 1619155 | Received 09 Nov 2018, Accepted 08 May 2019, Published online: 04 Jun 2019

Figures & data

Figure 1. Map of Q+ study sites by facility type.

Figure 1. Map of Q+ study sites by facility type.

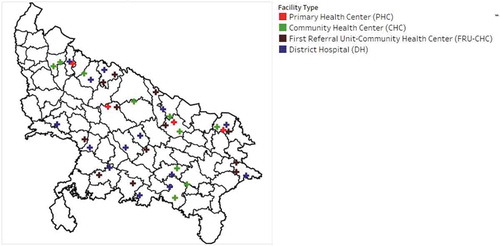
Table 1. Maternal Health Service Indicators*.

Table 2. Mean differences of Maternal Health Service Indicators, Stratified by Level of Care and Incentive Status*.

Figure 2. C-section rate by facility type.

Figure 2. C-section rate by facility type.

Table 3. Cohen Kappa Results for Categorical Facility Indicators.