
Figures & data
Figure 1. Schematic diagram of the change in the emissions from the model simulation toward health impact assessment.
Figure 2. Conceptual health prioritization scheme using the order of the health impact.
Figure 3. Global reference PM2.5 concentration in 2010.
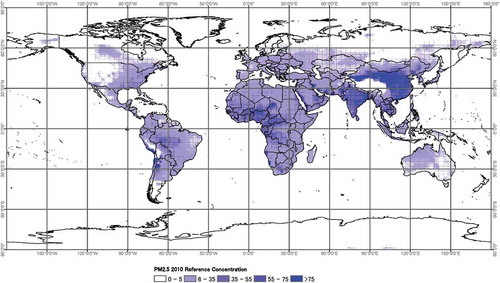
Table 1. Top 20 countries based on the decreasing interquartile range of gridded reference PM2.5 mean (in 2010).
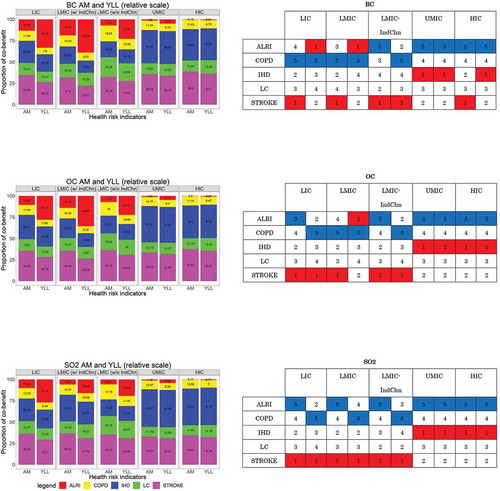
Figure 4. Country income-specific changes in the AM (left panel) and YLL (right panel) per change in BC (upper), OC (middle), and SO2 (lower) emission.
Dark-colored bars for LMIC indicate the contribution of China and India.
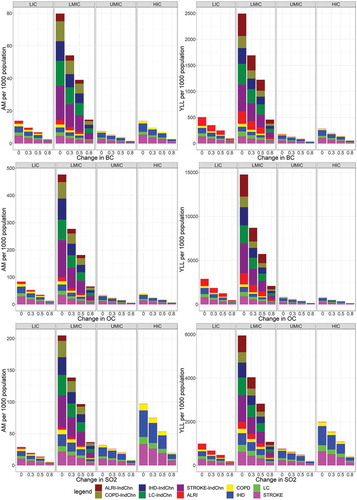
Figure 5. Proportion of reduction to 0% BC, OC, and SO2 benefits per health indicator (left) and schematic scoring (right).
Supplemental material