
Figures & data
Figure 1. Map of Jhaukhel–Duwakot Health Demographic Surveillance Site showing the intervention area (wards 1, 6, 7, 8, and 9 in Duwakot), control area (all wards in Jhaukhel), and a buffer zone (wards 2, 3, 4, and 5 in Duwakot); VDC, village development committee (according to old federal structure, before 2017–2018).
Figure 2. Enrollment, intervention allocation and follow-up of the mothers.
Table 1. Sociodemographic characteristics of mothers in intervention (Duwakot) and control (Jhaukhel) areas during baseline and follow-up.
Figure 3. Effectiveness of the health promotion intervention on mothers’ knowledge (a), attitude (b), and practice (c) regarding diet and physical activity. Note: Maximum possible scores for knowledge, attitude, and practice were 73, 192 and 17, respectively.
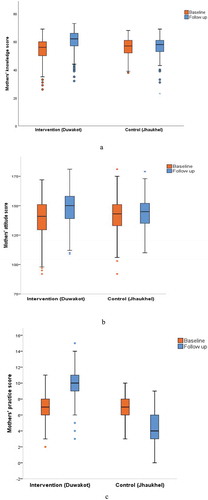
Figure 4. Effectiveness of the health promotion intervention on children’s behavior.
Maximum possible score = 110.
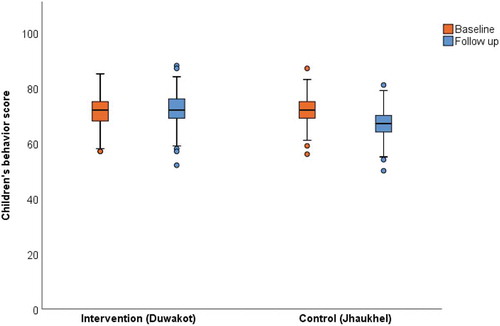
Table 2. Effectiveness of the intervention on mothers’ KAP and children's behavior as perceived by mothers regarding diet and physical activity.
Table 3. DiD analysis according to mothers’ and children’s demographic variables.