Figures & data
Figure 1. Framework for assessing the integrated model for HIV and non-communicable diseases in South Africa. Adapted from the WHO’s innovative care for chronic conditions (ICCC) framework [Citation1]
![Figure 1. Framework for assessing the integrated model for HIV and non-communicable diseases in South Africa. Adapted from the WHO’s innovative care for chronic conditions (ICCC) framework [Citation1]](/cms/asset/910697d2-e74e-4c50-a403-ee166708fc6f/zgha_a_1750216_f0001_oc.jpg)
Table 1. The themes and research objectives in the Vunene study
Figure 2. Pathways used to operationalise Avedis Donabedian’s theory of quality of medical care in the intergrated model
Figure 3. Map of the agincourt health and socio-demographic surveillance system site

Figure 4. A flow chart of sampling of the study participants in the Vunene study
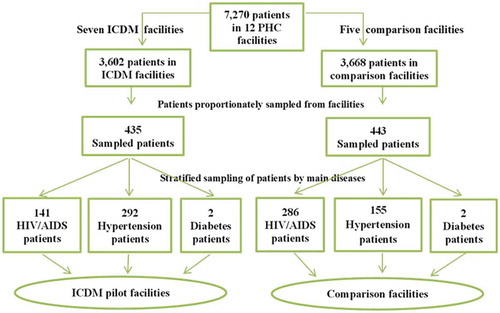
Figure 5. The domains of care in the integrated model assessed under the structure, process and outcome constructs. NB: The domains in red colour indicate the priority areas of the vertical HIV programme leveraged for chronic disease care in the integrated model
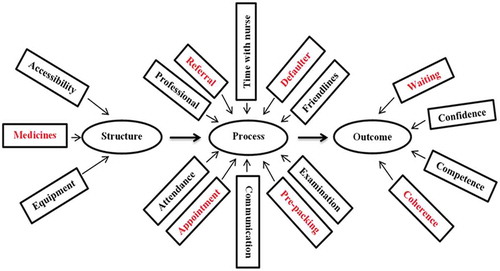
Table 2. The socio-demographic characteristics of patients in the ICDM pilot and comparison facilities in the Bushbuckridge municipality
Figure 6. Satisfaction scores of service users and providers with structural domains of care in the integrated model
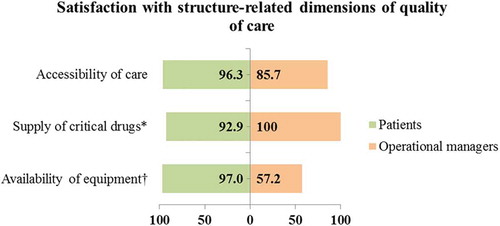
Figure 7. Satisfaction scores of service users and providers with process-related domains of care in the integrated model
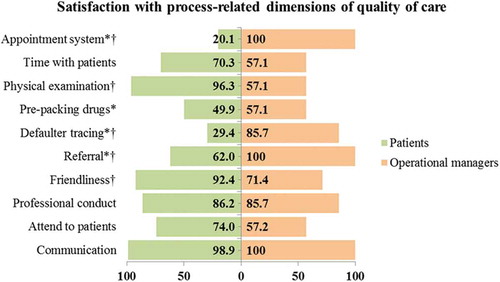
Figure 8. Satisfaction scores of service users and providers with outcome-related domains of care in the integrated model
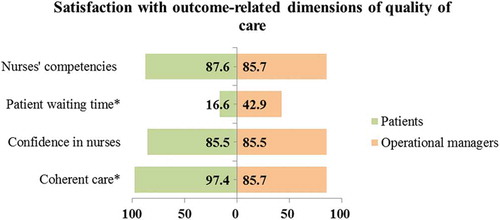
Figure 9. Assessment of correlation between structure, process and outcome constructs
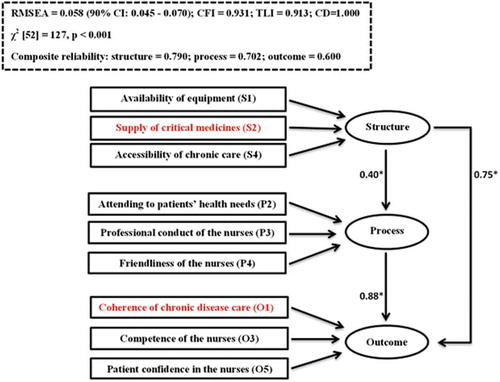
Table 3. Goodness of fit of the specified pathways used to evaluate the quality of care in the integrated model
Table 4. The autoregressive moving average model for CD4 count in health facilities in the Bushbuckridge municipality from January 2011 to June 2013
Figure 10. Monthly probabilites of controlling CD4 count (>350 cells/mm3) by study groups after propensity score matching
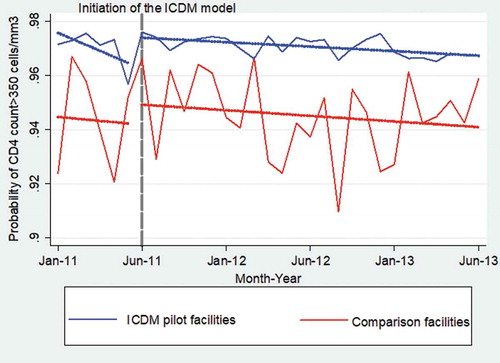
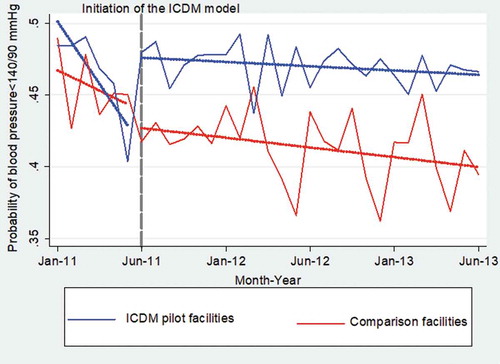
Table 5. The autoregressive moving average model for blood pressure control in health facilities in the Bushbuckridge municipality from January 2011 to June 2013
Figure 11. Monthly probabilites of controlling blood pressure (<140/90 mmHg) by study groups after propensity score matching