
Figures & data
Figure 1. Observed Years of Life Lost and Years Lost to Disability (rate per 100,000) for 10–24-year-olds in Myanmar across 9 categories, by age and sex. Data are from 1990 to 2017 and show overall trends using 5-year slices (the 2008 disaster is not shown). Dotted line indicates all-cause expected YLLs and YLDs. GBD (2017)
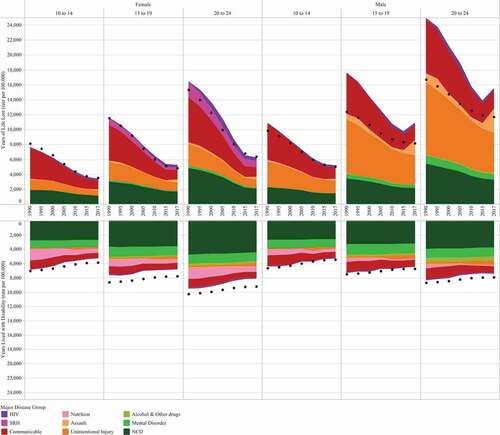
Table 1. Top ten causes of DALYs in 10–24-year-old females, 1990 and 2017. Rate (per 100,000) and annualised rate of change (ROC) %, GBD 2017
Table 2. Top ten causes of DALYs in 10–24-year-old males, 1990 and 2017. Rate (per 100,000) and annualised rate of change (ROC) %, GBD 2017
Figure 2. Causes of Disability Adjusted Life Years in 10–24-year-olds by sex in 2017. Each coloured box represents a disaggregated cause, the size of the box is proportional to the DALY rate per 100,000 for that cause. GBD (2017)
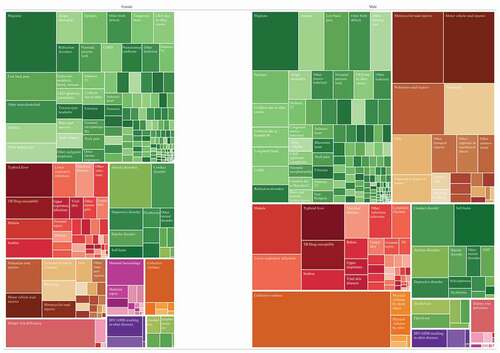
Figure 3. Selected health risks. (a) Prevalence of overweight/obesity among 10–19-year-olds (%) (BMI >+1 SD above the median), WHO (2016). (b) Prevalence of thinness among 10–19-year-olds (%) (BMI <-2 SD below the median), WHO (2016). (c) Prevalence of anaemia among 10–24-year-olds (%), GBD (2017). (d) Comprehensive knowledge of HIV, 15–24-year-olds. DHS (2016). (e) Prevalence of an episode of binge drinking (alcohol >48 g females, >60 g males), 10–24-year-olds, in the past 12mths (%), GBD (2016). (f) Prevalence of tobacco smoking among 10–24-year-olds (%), GBD (2017). (g) DALYs (per 100,000) due to drug use in 10–24-year-olds. GBD (2017)
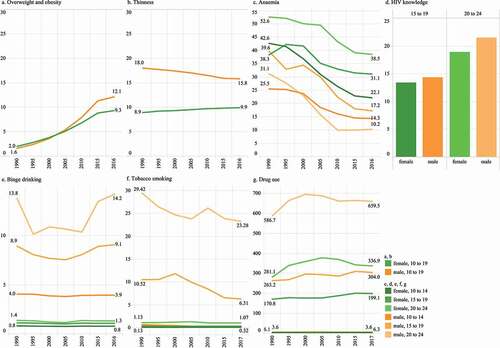
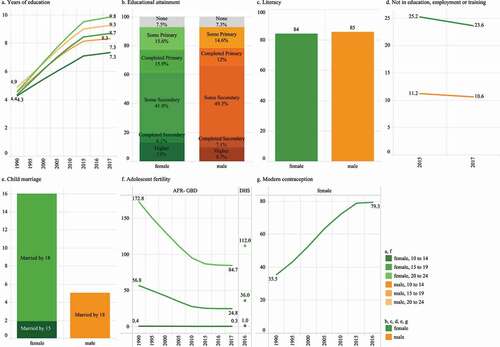
Figure 4. Selected social determinants of health. (a) Mean years of education in 10–24-year-olds, GBD 2017. (b) Educational attainment, 20–24-year-olds (%), DHS 2016. (c) Literacy, 15–24-year-olds (%), UNESCO 2019. (d) Not in education, employment or training, 15–24-years (%), ILO 2019. (e) 20–24-year-olds married before 15 years or 18 years (%), DHS 2016. (f) Live births per 1,000 females, 10–24-years, GBD 2017 & DHS 2016. (g) Demand for modern contraception satisfied, females 15–24-years (%), GBD 2016
Supplemental Material
Download PDF (1.3 MB)Data availability statement
The data that support the findings of this study are openly available in an online repository, references and weblinks available in supplementary material Table A1.