Figures & data
Table 1. Thematic groups, selected indicators and data elements for analysis and source documents used in this study
Table 2. Definitions of indicators and data elements in the routine Health Management Information System (HMIS) and the corresponding indicators in the Ethiopian Demographic and Health Survey (EDHS) 2016. HMIS indicator definitions from the Ministry of Health HMIS Indicators Reference Guide
Table 3a. Total number of women coming for postnatal care within two days of birth by region and month in the routine Health Management Information System, July 2017-June 2018. Internal consistency. Outliers within 2–3 standard definitions from the mean value per region or city administration are underlined and extreme outlier >3 standard deviation from the mean shown in bold
Table 3b. Total number of early neonatal death at community by region and month in the routine Health Management Information System, July 2014-June 2015. Internal consistency. Outliers within 2–3 standard definitions from the mean value per region or city administration are underlined
Figure 1. Number of regions and city administrations (n = 11) with internal consistency over time per routine Health Management Information System indicator or data element (n = 19)
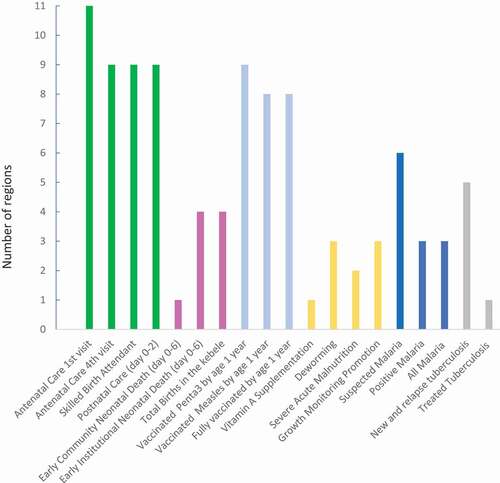
Figure 2. Number of routine Health Management Information System indicators (n = 19) that showed internal consistency over time per region or city administration (n = 11)
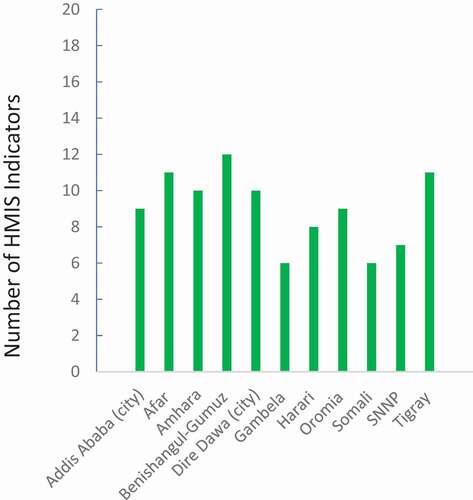
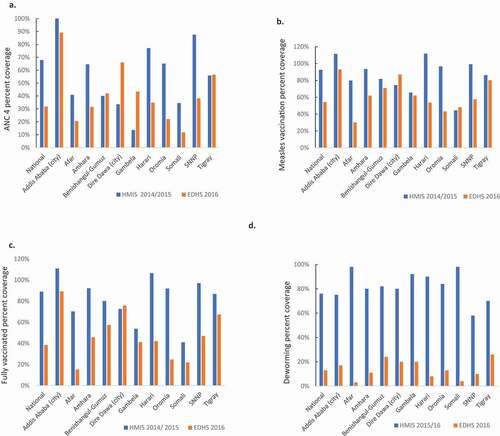
Figure 3. External consistency comparing the routine Health Management Information System (HMIS) data 2014/15 or 2015/16 (Ethiopian fiscal year 2007 or 2008) with the Ethiopian Demographic and Health Survey (EDHS) 2016 for (a) coverage of four antenatal care visits, (b) coverage of vaccinations against measles, (c) fully vaccinated 1-year old children and, (d) coverage of deworming of children