
Figures & data
Table 1. Data elements in Soweto and Thembelihle Health and Demographic Surveillance System
Table 2. Selected sub-places/clusters in Soweto with under-5 mortality estimates
Figure 1. Map of Soweto/Thembelihle Demographic Surveillance Areas (DSA). The 8 clusters presented are sub-places in Soweto, with Thembelihle neighbouring Soweto
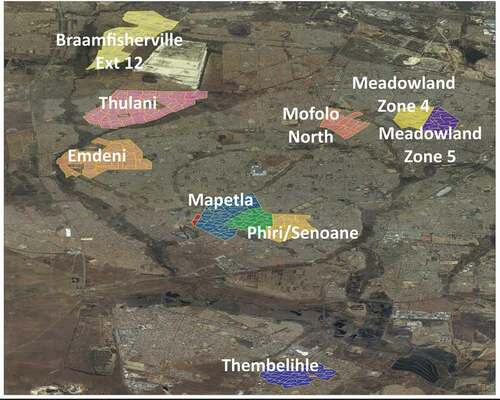
Table 3. Population under surveillance in SaT-HDSS (December 2019)
Figure 2. Pyramid of population under surveillance (SaT-HDSS 2019)
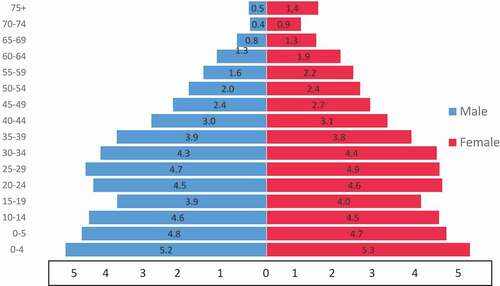
Table 4. Percentage distribution of the population under surveillance by selected socio- economic characteristics (SaT-HDSS 2019)
Table 5. Some key demographic indicators in SaT-HDSS (2019)