
Figures & data
Table 1. Cumulative number of COVID-19 cases and deaths and proportion of global cases/deaths by WHO Region, as of 13 December 2020
Figure 1. Number of COVID-19 cases reported weekly by WHO Region, 30 December 2019 through 13 December 2020
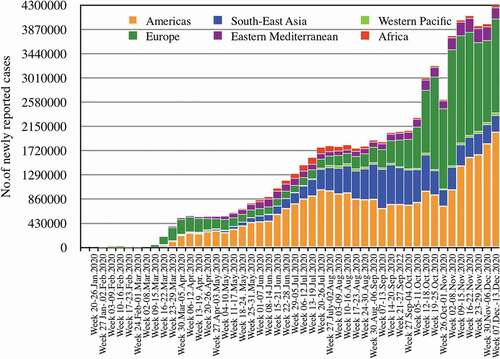
Figure 2. Number of COVID-19 deaths reported weekly by WHO Region, 30 December 2019 through 13 December 2020
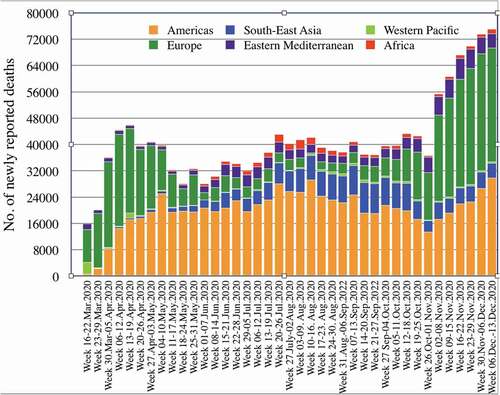
Figure 3. COVID-19 control interventions in China and number of laboratory-confirmed cases from 20 January to 20 December 2020
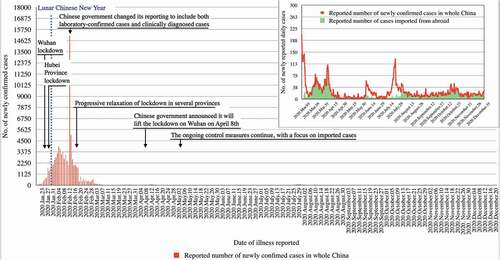
Figure 4. Covid-19 control interventions in Germany and number of laboratory-confirmed cases and deaths from 28 January to 20 December 2020
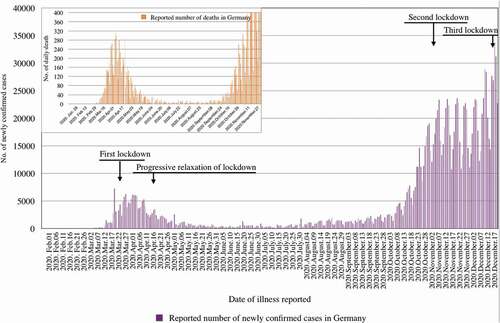
Table 2. Cumulative number of COVID-19 cases and deaths, case fatality rate (CFR), and deaths per 100,000 population in selected countries of the WHO European and the Western Pacific Region, as of 21 December 2020 https://coronavirus.jhu.edu/data/mortality