Figures & data
Figure 1. Conceptual point map of 64 statements in relative location based on number of times statements were co-sorted by 15 independent global health researchers.*
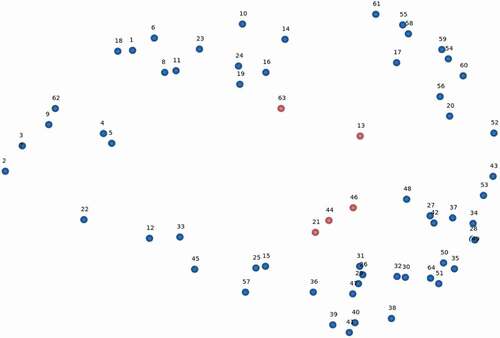
Figure 2. Point map of the project statements showing the central location of the statement: ‘13. Understanding the barriers to equitable health from the perspective of people in the last mile’.*
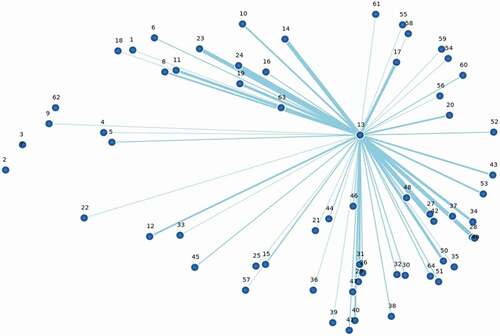
Table 1. Characteristics of the global health researchers who undertook the concept mapping process*
Table 2. The list of 64 unique statements provided by 15 global health researchers when prompted ‘Last mile research in global health includes, or should include, factors and characteristics such as…’
Figure 3. Final five cluster concept map for ‘last mile research’ determined through discussion and consensus with global health researchers
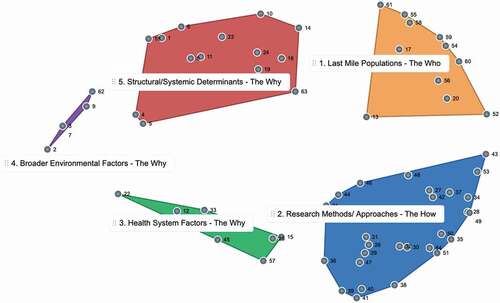
Table 3. Statements sorted into the five cluster areas
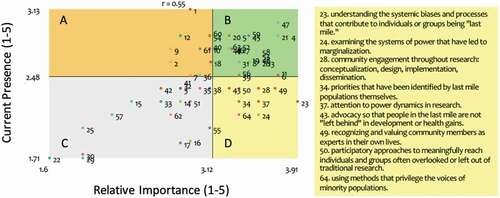
Figure 4. Identifying next steps- average level of importance and current presence ratings for 64 ‘last mile research’ statements as determined by 15 global health researchers.*