
Figures & data
Figure 1. Recruitment of the patient participants
Table 1. Sociodemographic characteristics of participants at baseline data collection (2015)
Figure 2. (a,b) The changes in FBG level (mmol/l, mean value) and knowledge score (mean value). (a) The changes of FBG level (mmol/l, mean value). (b) The changes of knowledge score (mean value)
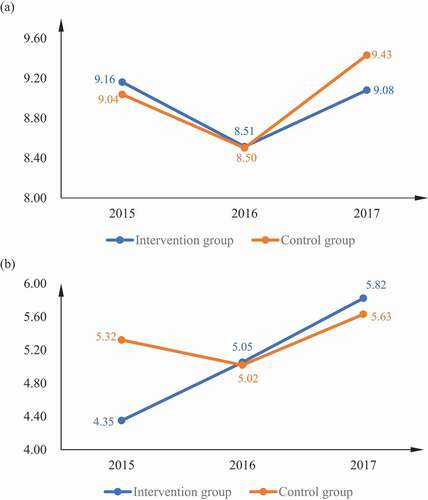
Table 2. Comparison* of knowledge score (mean value) and FBG level (mmol/l, mean value) between the intervention group and control group, at baseline and two follow-ups
Table 3. Mixed-effects linear regression model for diabetes knowledge score and FBG level and in both counties
Table 4. Stratified mixed-effects linear regression models for diabetes knowledge score and FBG level in Huaiyin and Gaochun
Table A1. Key elements of the intervention
Table B1. Questions related to diabetes knowledge