Figures & data
Table 1. Estimated average annual total ODA disbursements by sector and sectoral shares, and share of the bilateral and multilateral in the 29 DAC member countries, 2014–2018. Data were adjusted at constant prices of 2018. The sum of the percentages of bilateral and multilateral breakdown may not necessarily total to 100, given that data on core funding to multilateral agencies were not considered if the sectoral share data were not available in the OECD iLibrary. ODA: official development assistance; DAC: Development Assistance Committee
Figure 1. Ranking of estimated total, bilateral, and multilateral ODA by sector in the 29 DAC member countries-combined, 2011–2018. Blue and red blocks represent high and low sectoral shares, respectively. The orders of sectors and countries on axes are in descending orders of the total ODA disbursements during the study period (2011–2018). ODA: official development assistance; DAC: Development Assistance Committee
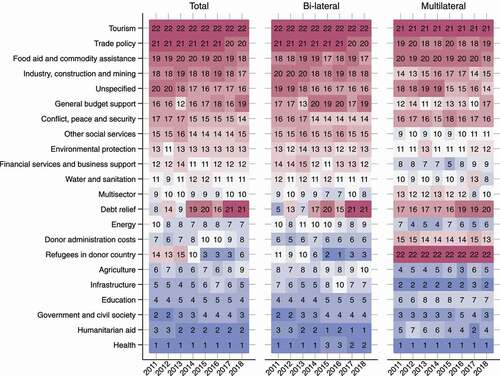
Figure 2. Ranking of estimated total (bi- and multilateral) ODA by sector in the 29 DAC member countries, 2011–2018. Blue and red blocks represent high and low sectoral shares, respectively. The orders of sectors and countries on axes are in descending orders of the total ODA disbursements during the study period (2011–2018). ODA: official development assistance; DAC: Development Assistance Committee
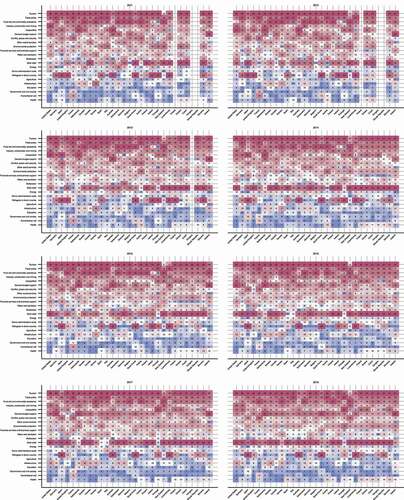
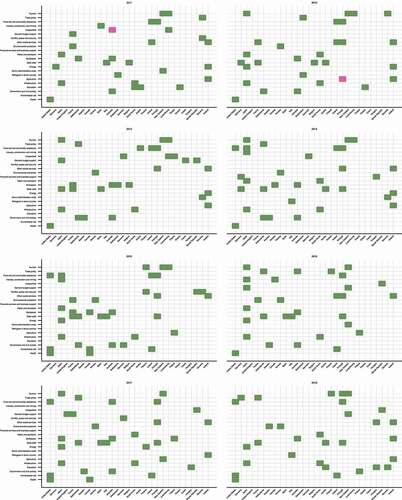
Figure 3. Outliers of estimated total (bi- and multilateral) ODA ranking by sector of the 29 DAC member countries, 2011–2018. Green blocks indicate higher sectoral shares compared to other countries, while pink blocks indicate lower shares. The orders of sectors and countries on axes are in descending orders of the total ODA disbursements during the study period (2011–2018). ODA: official development assistance; DAC: Development Assistance Committee