
Figures & data
Table 1. Demographic characteristics of the study participants
Table 2. Odds ratios for the diseases risks per one year increase from 2010 to 2017 across evacuation scenarios, adjusting for age
Figure 1. Annual age-adjusted prevalence of diabetes, hyperlipidemia, and hypertension by evacuation scenarios
Diabetes: HbA1c of more than 6.5%. Hyperlipidemia: low-density lipoprotein cholesterol of more than 140 mg/dL; or high-density lipoprotein cholesterol of less than 40 mg/dL; or triglyceride of more than 150 mg/dL. Hypertension: systolic blood pressure of more than 140 mm Hg; or diastolic blood pressure of more than 90 mm Hg. Logistic regression models were used to predict the prevalence, while holding age at the mean values among the whole participants (60.75): Solid lines are point estimates and shaded areas show 95% confidence intervals.
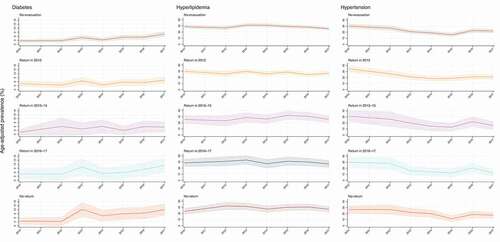
Table 3. Comparative risk of diabetes, hyperlipidemia, and hypertension at the 2017 health check-ups across evacuation scenarios in reference to the no-evacuation group
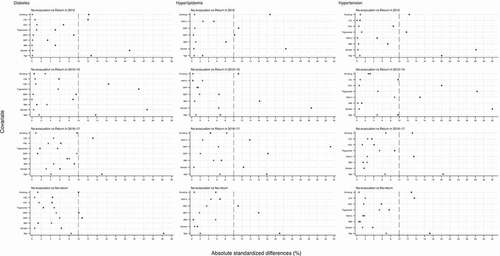
Figure 2. Absolute standardized differences for covariates in means before and after weighting for each comparison of evacuation scenarios in reference to no-evacuation
Diamond (blue) and cross (red) symbols refer to the before- and after-weighting, respectively. Diabetes: HbA1c of more than 6.5%. Hyperlipidemia: low-density lipoprotein cholesterol of more than 140 mg/dL; or high-density lipoprotein cholesterol of less than 40 mg/dL; or triglyceride of more than 150 mg/dL. Hypertension: systolic blood pressure of more than 140 mm Hg; or diastolic blood pressure of more than 90 mm Hg.
Supplemental material