Figures & data
Figure 1. Flowchart of inclusion of participants in the different components of the study
Table 1. Characteristics of 2885 adults and adolescents newly diagnosed with HIV at Ethiopian health facilities with regard to type of test modality
Table 2. Uni- and multivariable analysis of factors associated with ART initiation
Table 3. Uni- and multivariable analysis of factors associated with retention in care
Table 4. Viral load result available, among those eligible for testing (ie in care at time points for routine viral load testing, at 6 and 12 months after ART initiation)
Table 5. Uni- and multivariable analysis of factors associated with viral suppression
Table 6. Uni- and multivariable analysis of factors associated with each step of the cascade of care
Table 7. Male participants: uni- and multivariable analysis of factors associated with each step of the cascade of careresult available, among those eligible
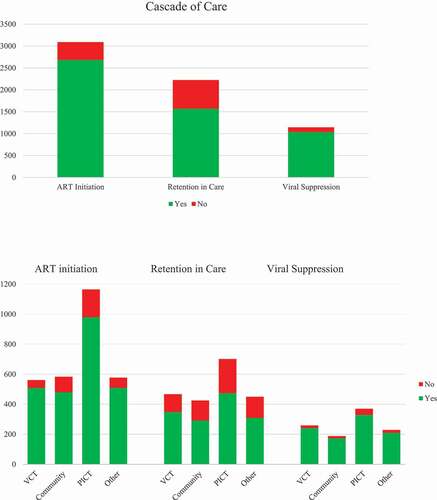
Figure 2. Cascade of HIV care for the overall population and disaggregated by test modality