Figures & data
Box 1. Definition of variables
Table 1. Summary of maternal and neonatal characteristics, neonatal deaths, and overall NMRs in Navrongo (2004–2012) and Kintampo (2005–10)
Figure 1. Distribution of neonatal deaths in Navrongo and Kintampo by age at death
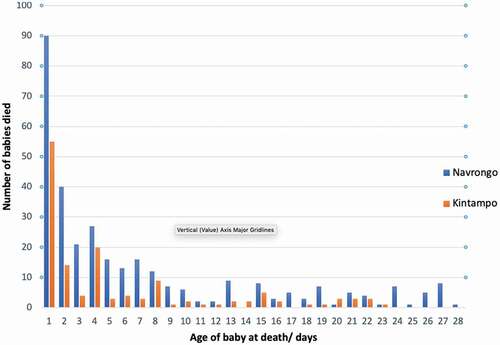
Table 2. Multivariable logistic regression analyses of factors associated with neonatal mortality in Navrongo (2006–2012)
Table 3. Multivariable logistic regression analyses of factors associated with neonatal mortality in Kintampo (2005–2010)
Figure 2. Forest plot of adjusted* odds ratio for the association between place of birth and neonatal mortality in Navrongo, according to age at death. (Left- Hospital births, Right- Clinic births, Reference line- Home births) Adjusted for place of delivery, year of birth, maternal age, SES, marital status, education, sex, multiple birth, parity, day of birth and year of birth
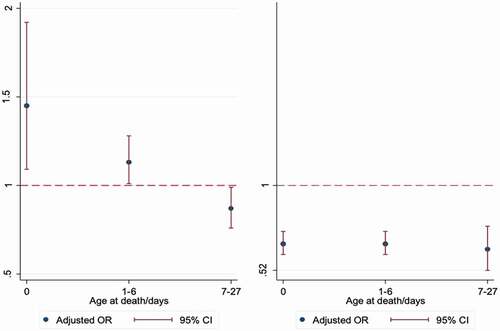
Figure 3. Forest plot of adjusted* odds ratio for the association between place of birth and neonatal mortality in Kintampo, according to age at death. (Left- Hospital births, Right- Clinic births, Reference line- Home births)
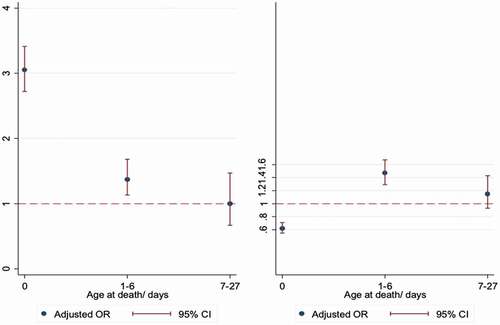
Figure 4. Number of neonatal deaths by place of birth/place of death according to age at death
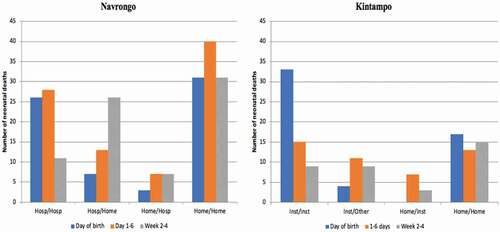
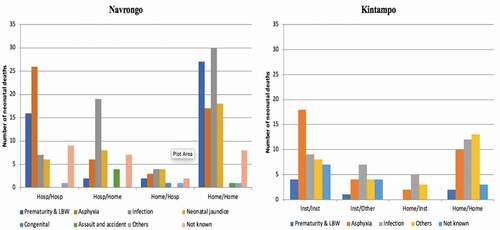
Figure 5. Cause of neonatal death by place of birth/place of death