Figures & data
Table 1. Characteristics of HIV/AIDS patients [n(%)]
Figure 1. Cumulative incidence curves of AIDS-related mortality in Henan province: 1995–2016 (N = 11,905). ((a) Cumulative incidence curves of AIDS-related mortality; (b) Cumulative incidence curves of AIDS-related mortality for HIV patients and AIDS patients; (c) Cumulative incidence curves of AIDS-related mortality for patients with initiation of ART and ART-naive; (d) Cumulative incidence curves of AIDS-related mortality for patients with different CD4+ cell counts)
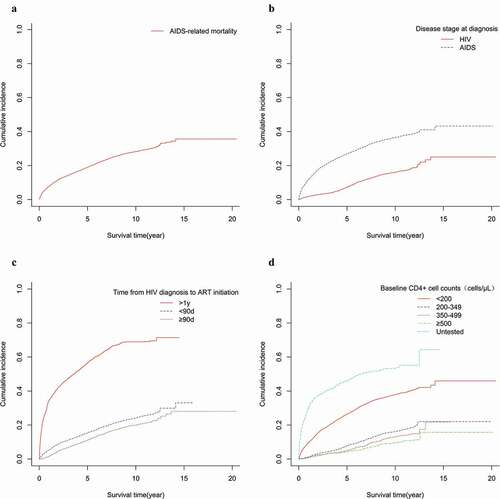
Table 2. Prognostic factors of entire study cohort and each subgroup based on baseline CD4+ cell counts [sHR (95% CI)]
Figure 2. AIDS-related mortality stratified by time of ART initiation and baseline CD4+ cell counts. (Competing risk model adjusted for gender, age, educational level, marital status, occupation, transmission, and disease stage at diagnosis)
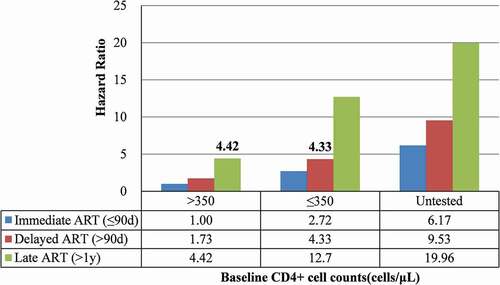
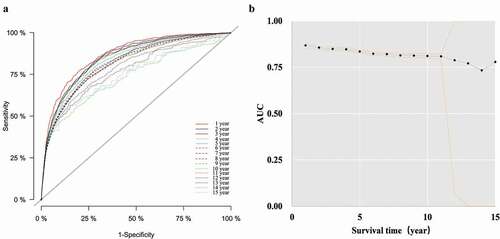
Figure 3. Model performance of entire study cohort based on time-dependent ROC. ((a) time-dependent ROC curve; (b) AUC(t) values and 95% CI)