Figures & data
Figure 1. The city (in black) into this research
Table 1. Summary statistics of meteorological data and air pollution (mean (SD)), mortality (mean (%)) from cause-specific cardiovascular diseases and individual characteristics, in Ganzhou during
Figure 2. Three-dimensional graph of the relative risks of cardiovascular mortality by daily mean temperature (°C) days and lag days, during 2015–2019. The relative risks for mortality of types of CVD and individual characteristics. The relative risks used eight of degree of freedom for time trend and daily mean temperature for temperature indicator. The reference temperature was the median temperature during the study period
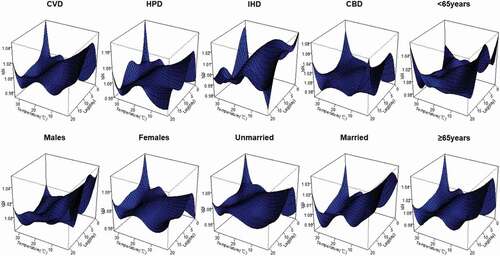
Table 2. The cumulative cold effects on lag 0, 0–7, 0–14, 0–21 days from cause-specific cardiovascular disease and individual characteristics
Figure 3. The relationship between mean temperature and the mortality of types of CVDs and individual characteristics and over lag 0–21 days, during 2015–2019. The green lines are the maximum likelihood estimate of relative risks, and the gray regions are 95% CIs. The solid line marks RR at 1
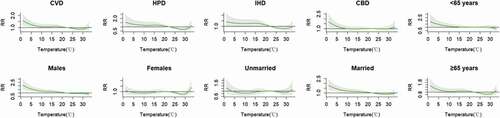
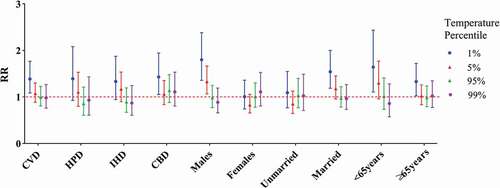
Figure 4. RRs showing the effect modification by various mortality subgroups at the 1st, 5th, 95th, and 99th temperature percentiles