
Figures & data
Table 1. Syndromic scoring system
Figure 1. The distribution of participant households by district1.
1 District locations are shown with a blue dot
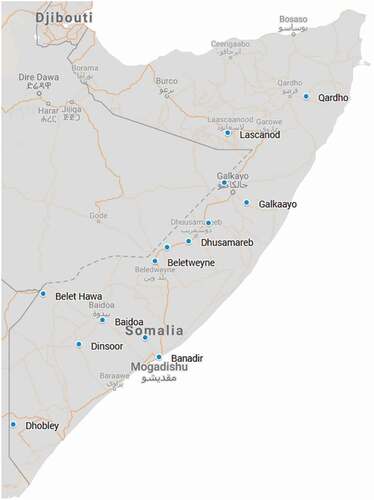
Table 2. Incidence of suspected COVID-19 infections in safety net beneficiaries
Figure 2. Comparison of laboratory confirmed cases published by WHO for Somalia and suspected symptomatic cases detected by the BRCiS monitoring system1.
1The horizontal bars indicate the recall periods for each round of data collection. In the first two rounds, a one-month recall period was used, contiguous recall periods were used in rounds 3 and 4, and a 3 month recall period (Jan–Mar) was used in round 5.
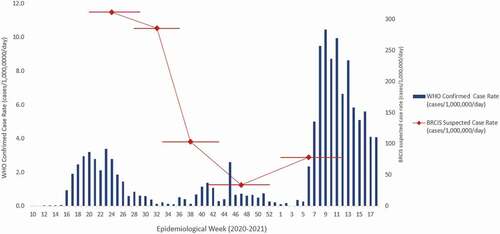
Table 3. Characteristics of participants with suspected COVID-19
Table 4. Crude, under-5 death, and cause specific death rates
Supplemental material