
Figures & data
Figure 1. Map of the study region showing intervention clusters and villages in which questionnaires were administered. In each village represented by a blue dot, 15 questionnaire interviews were performed
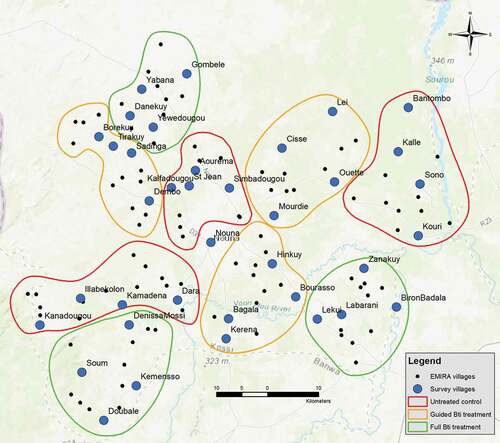
Figure 2. Willingness to pay for a larviciding program within the greater nouna region
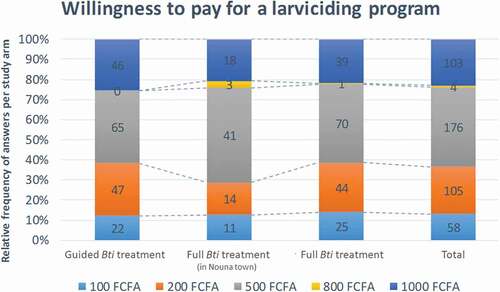
Table 1. Household characteristics
Table 2. Knowledge of malaria and its vectors
Table 3. Perception of and attitude towards malaria and vector control
Table 4. Practices regarding malaria and vector control
Table 5. Awareness and acceptance of the vector control activities
Supplemental material