Figures & data
Table 1. Summary of study facilities and participants
Figure 1. Schematic of themes and sub-themes
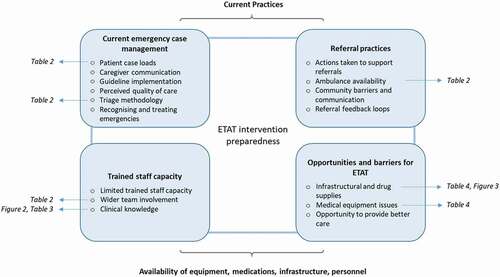
Table 2. Current triage and referral practices
Table 3. Linear regression analysis of ETAT knowledge
Figure 2. Proportion of maximum ETAT knowledge score for different healthcare provider types, according to ETAT training
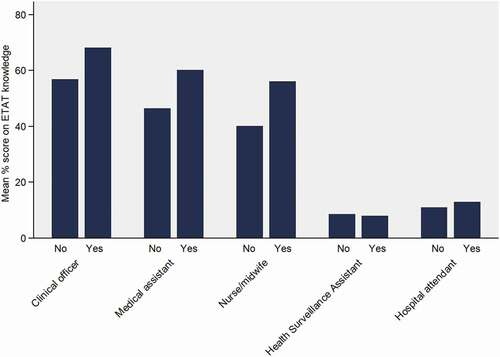
Table 4. Presence of essential ETAT equipment and drugs
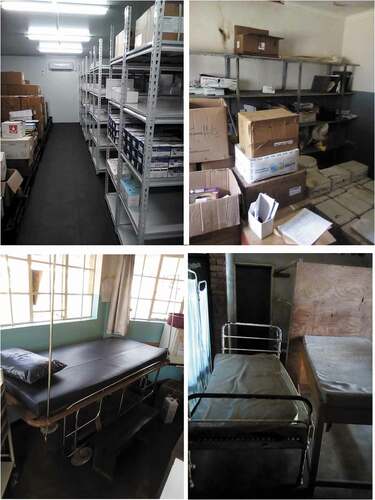
Figure 3. Examples of drug stores and triage rooms. a) Newly built drug store with temperature control in Mchinji District; b) Drug store without temperature control in Zomba District; c) short term stabilisation bed in Mchinji District; d) side-room for triage and stabilisation in Zomba district.