Figures & data
Figure 1. Trends in selected mortality indicators, Agincourt, South Africa, 1993–2018. (a) Overall mortality, (b) Under five mortality, (c) Adult mortality, and (d) Life expectancy at birth in Agincourt versus South Africa.
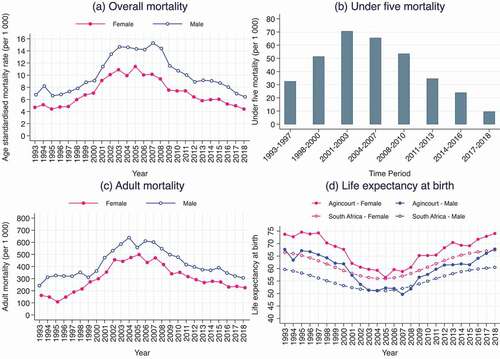
Figure 2. Distribution of deaths by cause categories in Agincourt versus South Africa 1993–2017.
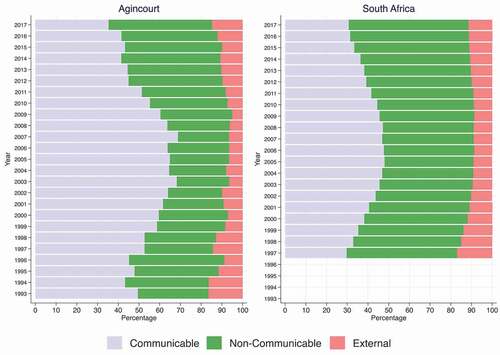
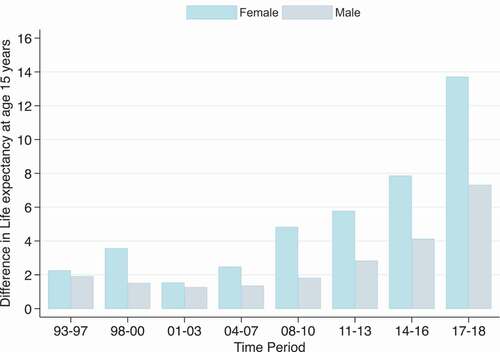
Figure 5. Potential increases in life expectancy at age 15 years that would result if deaths due to HIV/AIDS and TB were eliminated for males and females 1993–2018, Agincourt South Africa.
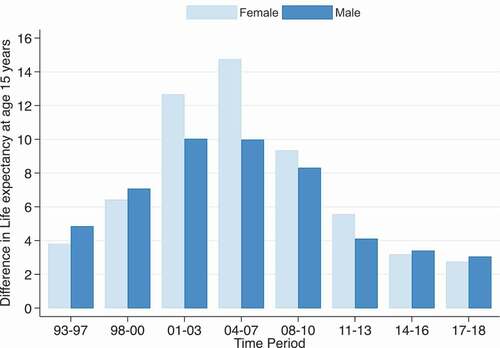
Figure 3. Leading causes of death in males 1993–2018, Agincourt South Africa.
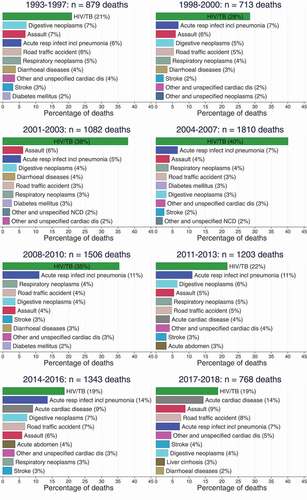
Figure 4. Leading causes of death in females 1993–2018, Agincourt South Africa.
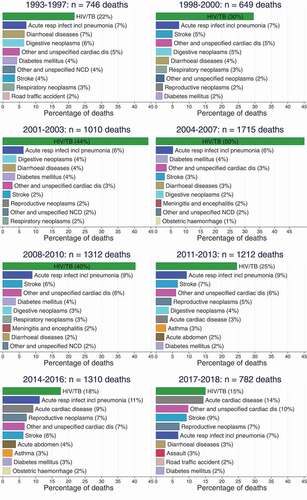
Figure 6. Potential increases in life expectancy at age 15 years that would result if deaths due to cardiovascular diseases were eliminated for males and females 1993–2018, Agincourt South Africa.