
Figures & data
Figure 1. Indonesian family life survey: Number of participants in present study following inclusion and exclusion criteria
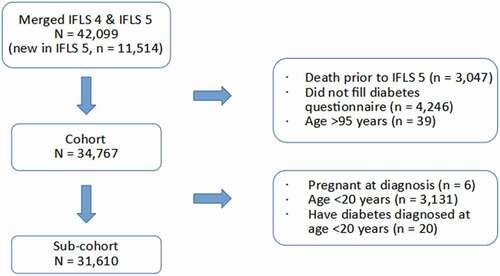
Table 1. Indonesian family life survey: Distribution of diabetes cases (based on self-report and HbA1c test) and prevalence estimates in the study cohort by age
Figure 2. Indonesian family life survey: Diabetes prevalence estimates in the cohort according to self-report and HbA1c measurement in different age groups and each sex
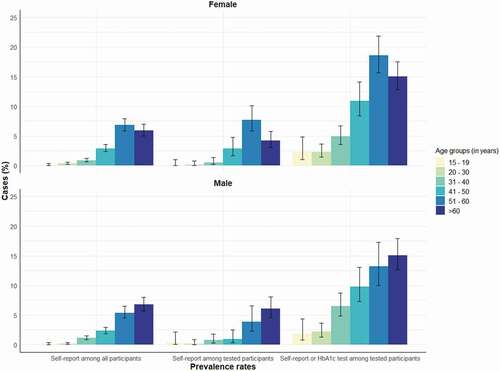
Table 2. Indonesian family life survey: Cohort characteristics defined by diabetes status and age at diagnosis (in years)
Table 3. Indonesian family life survey: Uni- and multivariable Cox regression analyses on sex and childhood conditions, Indonesia <1993 – 2014 > .
Supplemental material
